Measuring Social Capital: Can We Tell If Some Places Are Richer in Social Capital Than Others?
July 20, 2023
The concept of social capital has been inconsistently defined and described.[i] That should not be surprising, given that social capital is intangible and not easily measured. (The same is true of human capital, though researchers have defaulted to measures of educational attainment and test scores, only recently expanding the set of indicators to encompass noncognitive skills.) At root, social capital is about the value of relationships—to people and institutions.[ii]
Given the slipperiness of the concept, it is reasonable to ask whether we can measure social capital. In ongoing research with Kevin Corinth, we are exploring the development of individual-level social capital measures. However, research characterizing and quantifying the social capital of places already exists and paints a consistent picture: Social capital appears stronger (more valuable) in some places in America than others.
First, consider the Social Capital Index developed by the Joint Economic Committee (JEC) of the US Congress within Vice Chairman Mike Lee’s office. Figure 1 displays the state-level social capital values by decile. States shaded red and orange have the lowest levels of social capital, whereas states shaded green and blue have the highest levels of social capital.

Source: Social Capital Project, “The Geography of Social Capital,” Joint Economic Committee, April 2018, https://www.jec.senate.gov/public/index.cfm/republicans/socialcapitalproject.
Generally speaking, the southeastern and southwestern United States have the lowest levels of social capital, whereas a continguous group of states from the Upper Midwest and Mountain West and another constituting northern New England have the highest levels. The index is comprised of seven subindexes. Importantly, states that thrive in any specific subdomain of associational life—including family unity, family interaction, community health, philanthropic health, institutional health, collective efficacy, and social support—tend to thrive in all subdomains.
Each of the five states in the lowest decile of social capital—Louisiana, Nevada, New Mexico, Florida, and Arizona—consistently rank below the median on each subindex,[iii] suggesting that each subindex captures related features of social capital. Similarly, the six states in the highest decile of social capital—Utah, Minnesota, Wisconsin, New Hampshire, Vermont, and Colorado—tend to rank above the median across subindexes.[iv] Of the 21 cross-state correlations among the seven subindexes, all but one are positive.
The JEC researchers also created a county-level Social Capital Index, based on four subindexes. Figure 2 displays the index values for each county, broken down by decile.
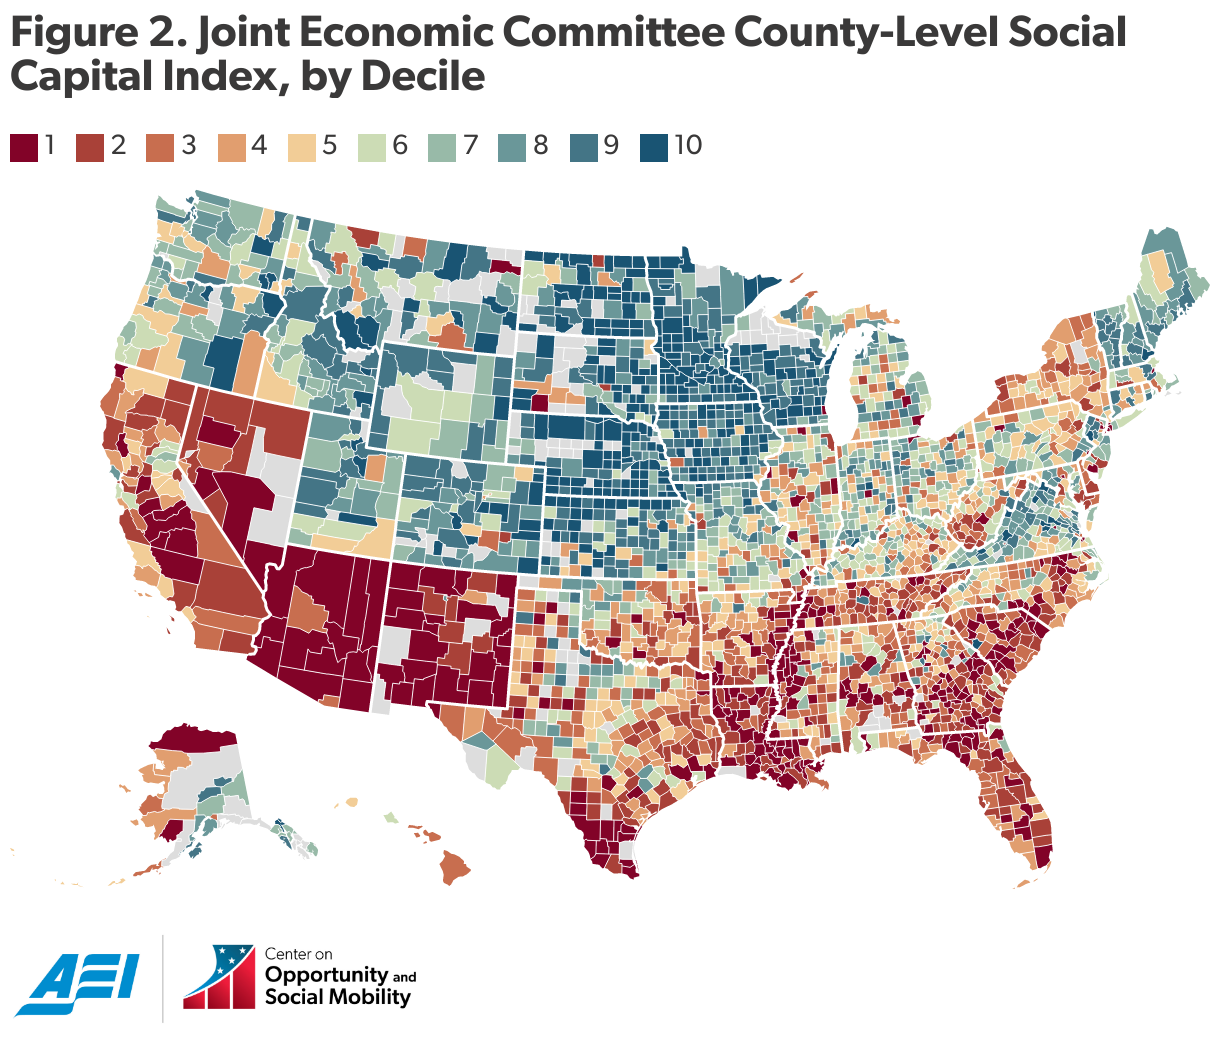
Source: Social Capital Project, “The Geography of Social Capital,” Joint Economic Committee, April 2018, https://www.jec.senate.gov/public/index.cfm/republicans/socialcapitalproject.
Unsurprisingly, states that are lowest in social capital—including much of the Southeast and Southwest—are also home to the counties with the lowest levels of social capital. Only 14 percent of all the counties in the five states lowest in social capital (185 counties for which we have data) escape the bottom three deciles at the county level.[v] Although there are some high-social-capital counties in relatively low-social-capital states (such as in Georgia and Alabama), almost all the counties in the Southeast and Southwest rank among the lowest in social capital.
Most counties in high-social-capital states also tend to be at the top of the county rankings. In the top-decile states, only 16 percent of the counties fall outside the top three deciles at the county level. There are, of course, outliers in every region. But both the state and county Social Capital Index show that some regions in the United States are characterized by thriving communities and strong social ties, while others suffer from broken families and social detachment.
Reassuringly, the social capital patterns produced by the JEC measures recur in other state- and county-level social capital indicators. In his foundational book Bowling Alone: The Collapse and Revival of American Community, Robert Putnam created a state measure based on 14 indicators. He took the indicators from data spanning 20 years, stretching from the late 1970s to the early 1990s. (The JEC measures were from data collected between 2010 and 2016.) The correlation between Putnam’s index and the JEC index is 0.81. Comparing Figure 3 (displaying Putnam’s measure) to Figure 1, it is clear that the two different measures rank the states similarly.
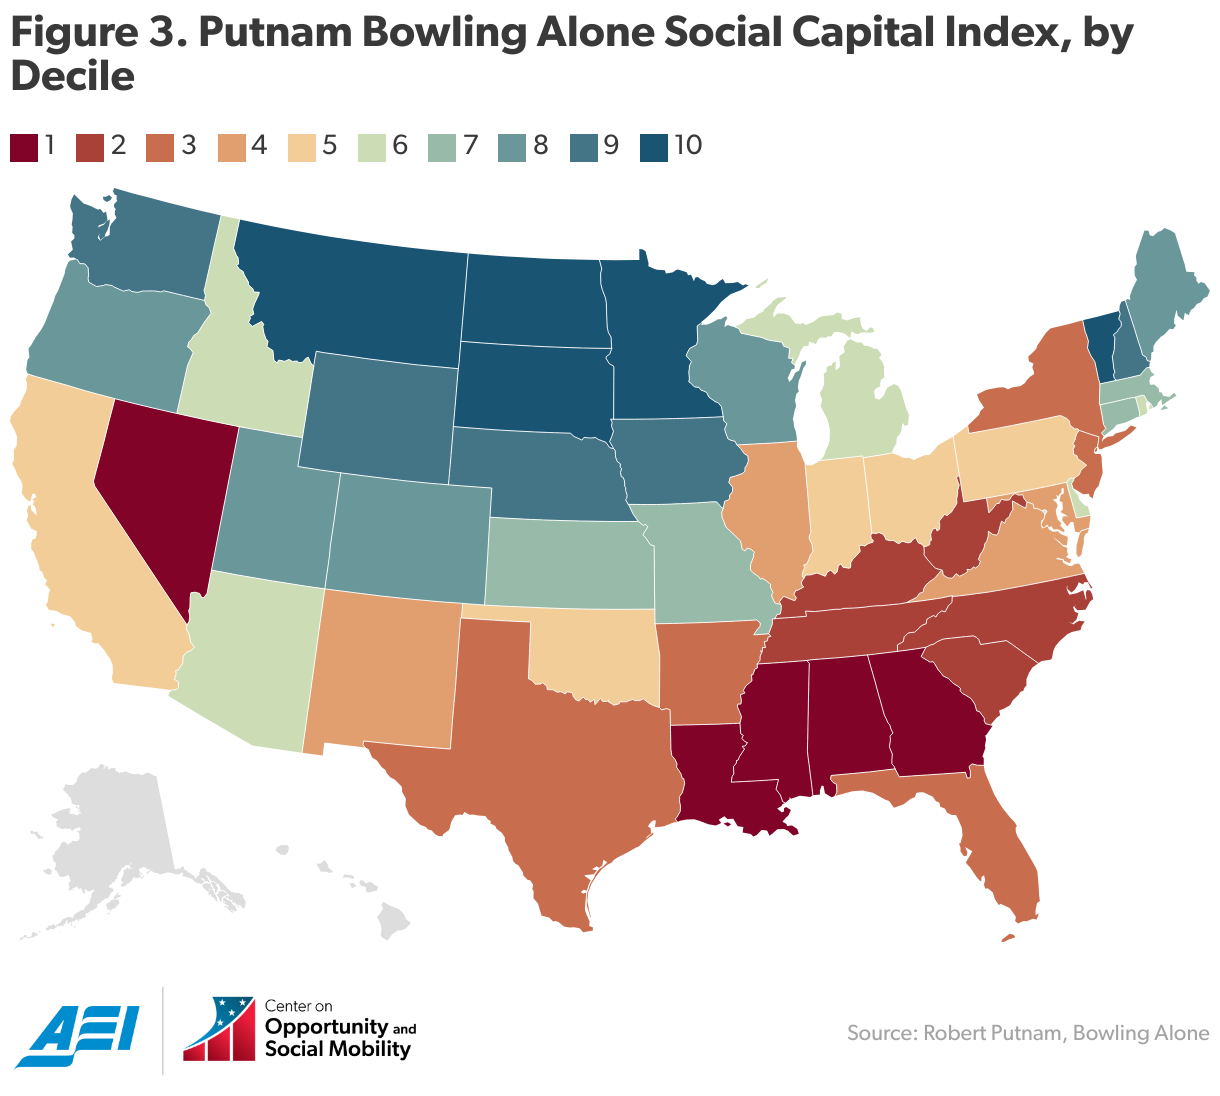
Source: Robert Putnam, Bowling Alone: The Collapse and Revival of American Community (New York: Simon & Schuster, 2000), http://bowlingalone.com/?page_id=7.
The JEC county-level measures are similarly strongly correlated with other carefully constructed county-level measures. In two recent papers, Opportunity Insights measured three aspects of social capital. The indicator that it focused most on—economic connectedness, or the extent to which people with lower socioeconomic status have high-economic-status Facebook friends—is strongly correlated with the JEC measure across counties. (The correlation is 0.75.) Comparing Figure 4 (showing the Opportunity Insights economic connectedness measure) and Figure 2 makes clear the similar patterns the two measures produce.

Source: Raj Chetty et al., “Social Capital I: Measurement and Associations with Economic Mobility,” Nature 608, no. 7921 (2022): 108–21, https://socialcapital.org.
Data from a variety of sources that are collected in different decades, measuring different aspects of social capital, and combined in different ways tend to identify the same places that have borne the brunt of deteriorating associational life and the same places that appear to be thriving. This concurrence means that researchers can meaningfully characterize the social capital levels of different parts of the country and attempt to discern the causes of geographic variation in social capital and the consequences. Future research in this series will aim to understand what makes the state of social connections so vibrant in some places and what can be done to strengthen social capital in struggling areas.
[i] Tristan Claridge, “Current Definitions of Social Capital: Academic Definitions in 2019,” Institute for Social Capital, January 15, 2020, https://www.socialcapitalresearch.com/current-definitions-of-social-capital.
[ii] Scott Winship, “Social Capital: What Is It?,” Social Breakdown, April 28, 2023, https://www.aei.org/articles/social-capital-what-is-it.
[iii] The only exceptions are Nevada, which ranks 16th in philanthropic health, and New Mexico, which ranks 23rd in community health.
[iv] The only exceptions are Utah, which ranks 30th in institutional health, and Vermont, which ranks 40th in philanthropic health.
[v] Authors’ calculations using Joint Economic Committee Social Capital Project data.


