Home Price Appreciation Index and Months’ Remaining Inventory
The AEI Housing Center aims to monitor market trends through accurate, real-time tracking of house prices. Our new dataset on home price appreciation appears significantly before other indices and with substantially more geographic detail. Combined with data from Realtor.com and Zillow on months’ remaining inventory, these data provide the most up-to-date look at housing market conditions by price tier in 60 of the largest US metropolitan areas, as well as the nation as a whole.
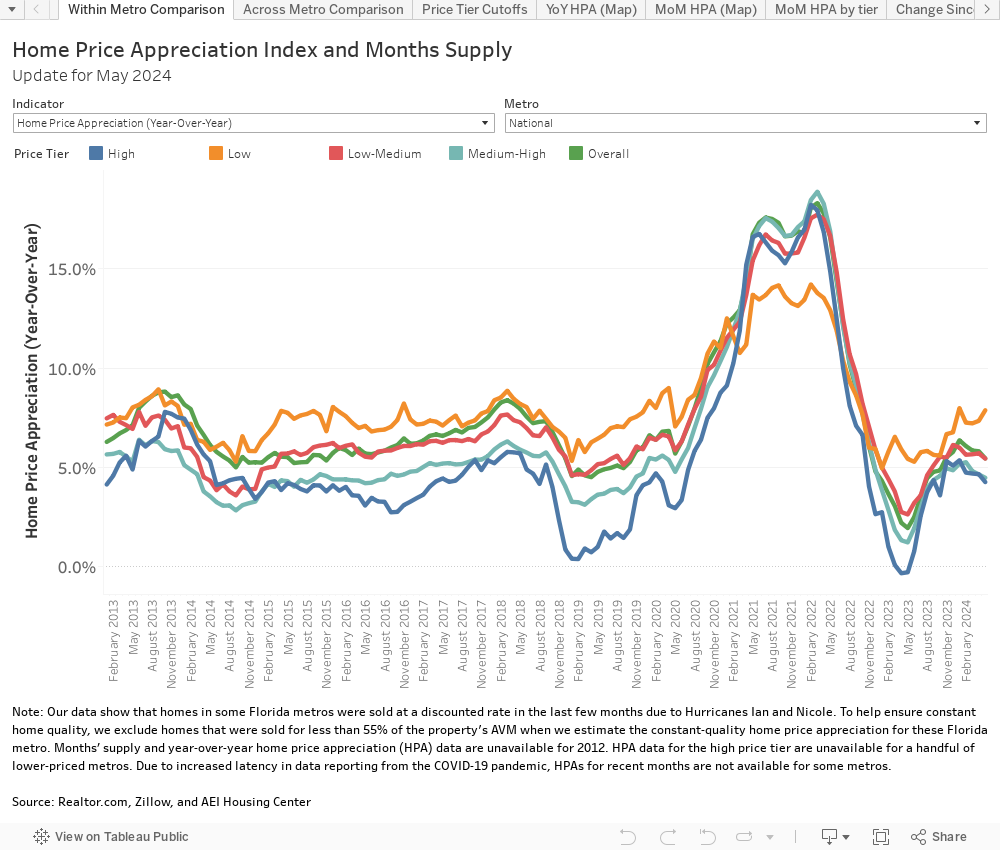
How it works: The interactive has three tabs. The first allows for price tier comparisons within a particular metro, the second allows comparisons across metros, and the third shows a map. Under the first two tabs, you can filter results by indicator and metro, with additional filters for price tier and time period available on the Across Metro Comparison tab. The visualization will change with your selections. The map groups the rate of year-over-year home price appreciation into deciles for each price tier and time period. All data are available for download here.
See our most recent HPA report below, or click here to view the PDF.
METHODOLOGY
Home Price Appreciation Methodology:
Basics of HPA index construction
HPA is a “quasi” repeat sales index with a hedonic element. The index measures HPA by constructing an artificial sales pair consisting of one actual sale and one “artificial” sale as measured by the property’s Automated Valuation Model (AVM.) The AVM approximates a property’s sale price at a given point in time. The AVM used is on average unbiased and accurate.
Advantages of AEI’s HPA Index:
It combines the best of repeat (Case-Shiller and FHFA) and hedonic (Zillow) models.Unlike a true repeat sales index, which is limited to repeat sales and may therefore be biased, AEI’s index includes the entire universe of sales. Unlike a true hedonic index, which incorporates every property (even unsold ones), it reduces the amount of errors since at least one sale of the transaction pair actually occurred. Allows for an index construction by price tier and fine geographic levels (down to census tract).
Data for the HPA index
National Public Records data and AVM for Dec-2018 come from First American via DataTree.com, which include virtually all institutionally financed and cash sales back to January 2012. Data are weighted at the county level to adjust for minor amounts of missing data. HPAs for the medium-high and high price tiers are spliced around the time of loan limit changes. Data exclude new construction sales, sales of distressed properties, and sales of properties that sold multiple times within a one year period. The final dataset includes 16 million purchase transactions. Data for the most recent month are preliminary.
Months’ Supply Methodology:
Months’ supply measures how many months it would take for the inventory of existing homes for sale to be exhausted at the current sales pace. Across all price points, six months is generally considered the demarcation point between a buyer’s and seller’s market. AEI estimates that this demarcation point varies by price tier due to differential pace of sales.
Data on listings come from Realtor.com and are combined with sales data from public records. Months’ supply is calculated by dividing the total number of existing home listings by the total number of existing home sales. Existing home sales for the most recent months are adjusted using HMDA and Optimal Blue data to account for latency in the public records. Months’ supply data prior to June 2016 are backfilled with data provided by Zillow. All data are available at the price tier level.
Price Tier Methodology:
The four tiers are set at the metro level, adjusted quarterly, and defined as follows:
- Low: all sales at or below the 40th percentile of FHA sales prices;
- Low-Medium: all sales at or below the 80th percentile of FHA sales prices;
- Medium-High: all sales at or below 125% of the GSE loan limit; and
- High: Rest. HPAs are smoothed around the times of FHFA loan limit changes.
- Entry-level price tier: about 75% of the borrowers in the Low and Low-Medium price tiers are first-time buyers.
- Move-up price tier: about 75% of the borrowers in the Medium-High and High price tiers are move-up buyers.
FHA sales prices come from the FHA Snapshot data and assume a CLTV of 98.2%.
Tier shares as a percentage of national financed home sales:
- Low: about 28%;
- Low-Medium: about 28%
- Medium-High: about 36%
- High: about 8%
Due to data latency, we do not show recent months of HPA for certain metros. Due to low sales in the high price tier, we do not show HPA trends for a few metros. The HPA data are preliminary for the most recent month.
Benchmarking the AEI HPA Index
Click here to view PDF