National and Metro Housing Market Indicators
Metro Housing Market Indicators Update for 2023:Q1
Housing markets are inherently local and national data can obfuscate important local trends.
While some metros continue to benefit from tailwinds in the form of lower home prices, growing economies or attractive climates, others face headwinds in the form of higher taxes, outmigration, and concerns about safety.
New AEI Housing Center data analyze the largest 100 housing markets by market segment.
Key takeaways from the Metro Housing Market Indicators for 2023:Q1:
- San Jose, San Francisco, and Los Angeles had the highest home prices in the nation, while Toledo, Akron, and Rochester had the lowest.
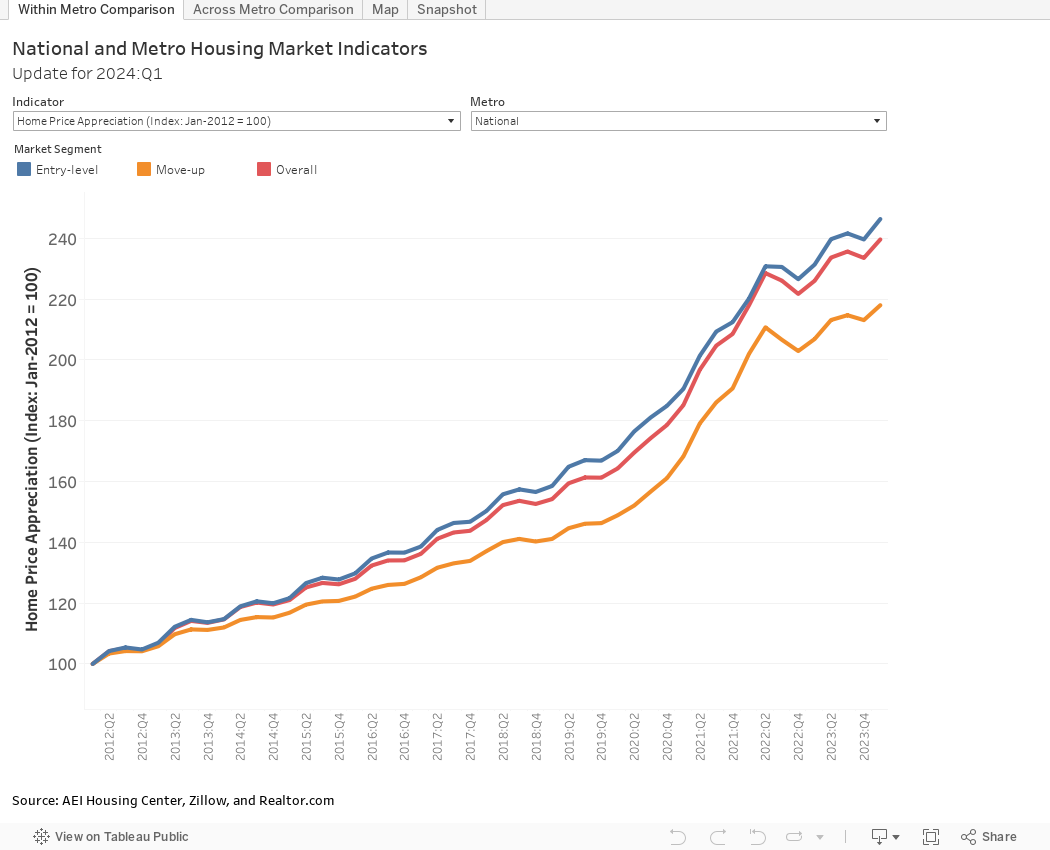
- Compared to the start of the home price boom in 2012, most metros in the West and Florida are up over 200%, while some metros in the South and Midwest are up 60%.
- Home price appreciation varied significantly by metro: San Jose, San Francisco, and Seattle have seen declines of around 11% from a year ago; while Indianapolis, Miami, and Provo have seen increases of around 10%.
- Over the last quarter, 31 metros had positive home price growth, while 3 metros had negative growth of 4% or more. Based on our more frequent monthly data, we expect even more metros to have positive home price growth in 2023: Q2.
- The share of entry-level buyers varied from around one-quarter (San Jose) to three-quarters (McAllen).
- While supply of existing homes remained tight for most metros, new construction activity varied greatly by metro.
- Additions to the existing housing stock between 2013:Q1 and 2023:Q1 ranged from 21% in Austin to 1% in New Haven.
- The AEI mortgage default rate (MDR), which measures the riskiness of originated loans, was highest in McAllen (19%), Baton Rouge (18%) and Lakeland (17%), largely due to a high share of FHA loans. Potentially rising unemployment and persistent inflation could expose overleveraged borrowers in these markets, which could translate into increased foreclosure activity.
The nation in 2023:Q1 by the numbers:
- Year-over-year rate of Home Price Appreciation (HPA): 1.6%
- Quarter-over-quarter rate of Home Price Appreciation (HPA): -0.1%
- Months’ supply: 3.7
- AEI mortgage default rate: 12.0%
- Share of buyers of entry-level homes: 57%
- Share of new construction sales (compared to all home sales): 13.0%
- New construction contribution to existing housing stock (2013:Q1-2022:Q4): 5.6%
- Median sale price for entry-level homes: $257,000
For monthly and most up-to-date home price appreciation and months’ supply data for the largest 60 metros, please click here.
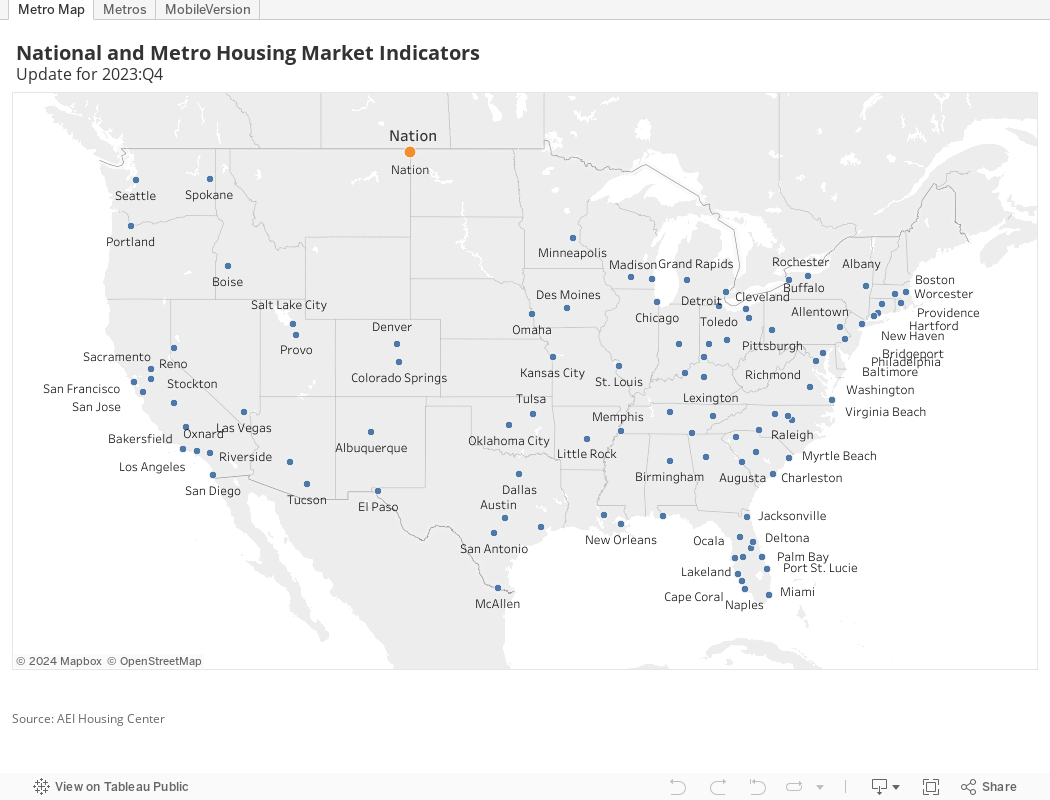
Please select your metro on the map to explore the data and to download an individual report.
To download all 100 metro reports, click here. The national report is available here. To download the time series data for the nation and all 100 metros, click here.
To contact the authors:
Edward Pinto, Director, AEI Housing Center ([email protected])
Tobias Peter, Director of Research, AEI Housing Center ([email protected])
Methodology:
Data
For this study, we primarily rely on public records data from First American (DataTree.com). The data consists of around 43 million arms-length purchase transactions from 2012 to the most recent period. We eliminate transactions that do not involve at least one individual, that are between corporations or builders, or transactions for which the buyer is a government entity or a lender. The final dataset consists of nearly 36 million transactions.
Market Segments
The study tracks housing activity both for the entire market and for entry-level and move-up buyer segments. We only focus on institutionally financed sales (meaning we exclude cash sales or sales with seller financing.) We define entry-level as all sales below the Federal Housing Administration (FHA) 80th percentile price in a metro and quarter. The rational for a dynamic price cut-off at the metro level is that the share of entry-level buyers varies across the country. According to FHA’s Production Report, around 80% of FHA’s purchase loans go to first-time buyers, who mostly compete with other first-time buyers from other agencies for entry-level housing. The 80th percentile price cut-off, therefore, captures this market segment reasonably well. This is confirmed by the data. Across the nation, the entry-level segment consists largely of first-time buyers, while the move-up segment consists mostly of repeat buyers.
The data to compute the FHA price cut-offs come from the HUD FHA Single Family Portfolio Snap Shot, which is a census of all FHA endorsements.
House Price Appreciation
AEI’s HPA index differs from the most widely known house price indices, which are either repeat sales (i.e. Case Shiller or FHFA) or hedonic (Zillow) indices. AEI creates a “quasi” sales pair consisting of one actual sale and a second reference “sale” as measured by the home’s estimated sales price using an Automated Valuation Model (AVM). The AVM approximates a property’s sale price at a given point in time. The AVMs come from First American (DataTree.com) and are unbiased with a high level of accuracy.
The advantage of this approach is that it combines the best of the repeat and hedonic models. Unlike a true repeat sales index, which is limited to repeat sales and may therefore not be representative of the actual sales taking place during the measurement period, AEI’s index includes virtually the entire universe of sales during the period. And, unlike a true hedonic index, which incorporates every property (even unsold ones), it reduces the amount of errors since at least one sale of the pair actually sold during the measurement period. This also allows for index construction by market segment and at fine geographic levels.
The AEI HPA index is based on a high proportion of institutionally financed home sales (after eliminating some extreme outliers) back to January 2012. The data are weighted at the county level to assure that they are representative of the full count of actual sales.
Months’ Supply
Data on listings come from Realtor.com and are combined with sales data from public records. Months’ supply is calculated by dividing the total number of existing home listings by the total number of existing home sales. Existing home sales for the most recent months are adjusted using HMDA and Optimal Blue data to account for latency in the public records. Months’ supply data prior to June 2016 are backfilled with data provided by Zillow. All data are available at the price tier level. We aggregate the data up to the metro level and break them out into entry- and move-up buyers.
AEI Mortgage Default Rate
The AEI Mortgage Default Rate measures how the loans originated in a given month would perform if subjected to the same stress as in the financial crisis that began in 2007. This is similar to stress tests routinely performed to ascertain an automobile’s crashworthiness or a building’s ability to withstand severe hurricane force winds.
Mortgages are risk rated using a matrix of benchmark default rates for home purchase loans acquired by Freddie Mac in 2007. A detailed methodology of the National Mortgage Default Rate can be found here.
Newly constructed homes
The data to identify new constructions come from different data sources. The inputs are public records data (deed & assessor files) and Listings data from Zillow. We primarily rely on a home’s “year built” variable in the assessor file. If the “year built” is missing, we check the home’s seller name from the deed file. If the seller matches a name in a list of over 400 builders or it includes a key word that helps identify smaller builders, then the sale is most likely a new construction that has not yet been assessed.
In the case that “year built” or seller name are missing, we check listings data for a “year built” or “land use code,” which helps us determine the new construction status of the home. We only count the first sale of a home as a new construction.
We have verified the accuracy of our methodology through random sampling and checking of newly constructed and existing homes using Zillow data, Google Street View and satellite images. We find around 2% false positives and around 1% false negatives, which leads us to conclude that our methodology is very accurate.
We estimate the residential housing stock from the assessor file. We eliminate multifamily and non-residential sales to arrive at an estimate for the total housing stock. Since the data are overwritten once new assessments at the county level become available, the data show the stock when it was last assessed. No historical estimates are available.
List of metros
Our analysis is done at the metro level. We use the National Bureau of Economic Research’s (NBER) county to CBSA (core based statistical area) crosswalk files for 2017 to aggregate counties into metros. We create Housing Market Indicator reports for the nation’s largest 100 metros (excludes Ogden, UT due to data volatility issues). We rank metros based on their purchase home sales from 2012 to 2019 in the Public Records.
Download a complete list of the 100 metros and their counties.
Note on Seasonality:
The housing market is seasonal. Buying activity tends to be strongest during the spring buying season and summer months, before pulling back during the fall and winter months. This trend is heavily tied to school and weather cycles as people like to be in their new homes for the beginning of the school year and stay put during colder months. Furthermore, potential homebuyers can only buy when there is inventory for sale. As a result, house prices tend to pick up steam during the spring and summer, and slow during the fall and winter. Because of this seasonality, we measure most housing indicators by comparing them to the same quarter a year ago.
About AEI
The American Enterprise Institute, AEI, is a nonpartisan public policy research institute with a community of scholars and supporters committed to expanding freedom, increasing individual opportunity, and strengthening the free enterprise system in America and around the world.
About the AEI Housing Center
AEI’s Housing Center (AEI.org/housing) undertakes evidence-based research that expands the body of knowledge concerning housing markets and finance. It provides objective and transparent housing market indicators at the national, metro, and fine geographic levels.