New Construction Data
AEI-Zillow New Construction Sales Index
A lack of new housing construction is one of the most pressing issues facing the U.S. housing market. The AEI-Zillow New Construction Sales Index provides new construction data and trends over time at the national, state, metro, county, ZIP code, and census tract levels. Data include new construction sales, the average new construction price, and the number of new construction sales, which are also broken out by price tier. Below, we also provide heat maps of new construction sales in the largest 100 metros.
To download the new construction data, please click here.
To download the methodology document, please click here.
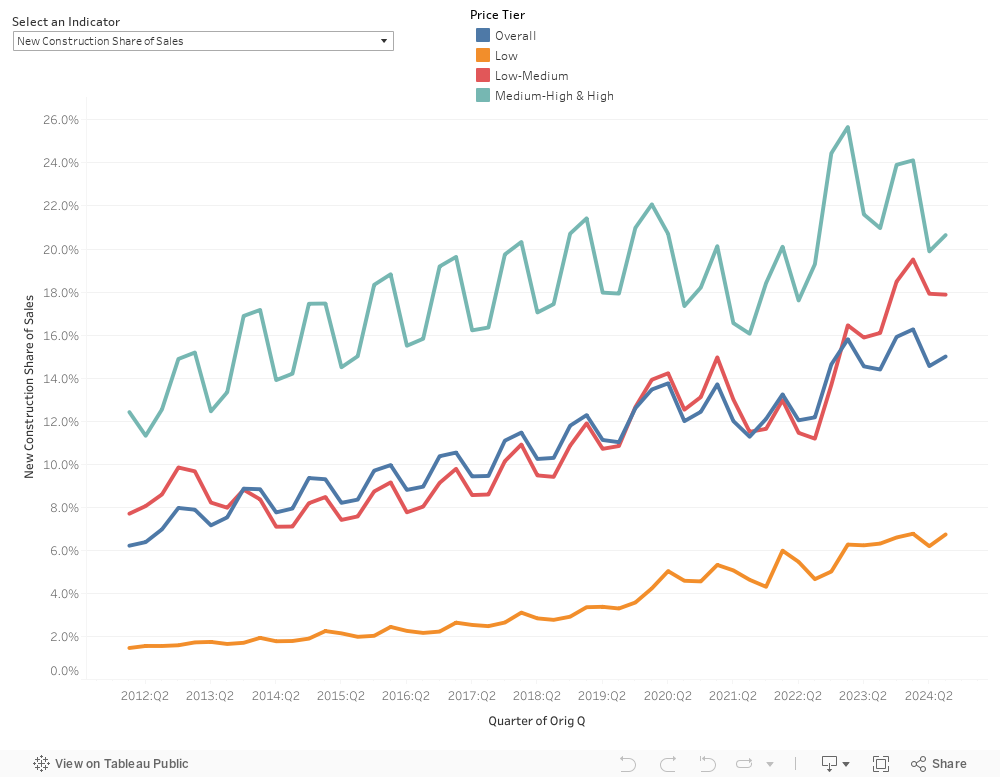
National New Construction Data Snapshot
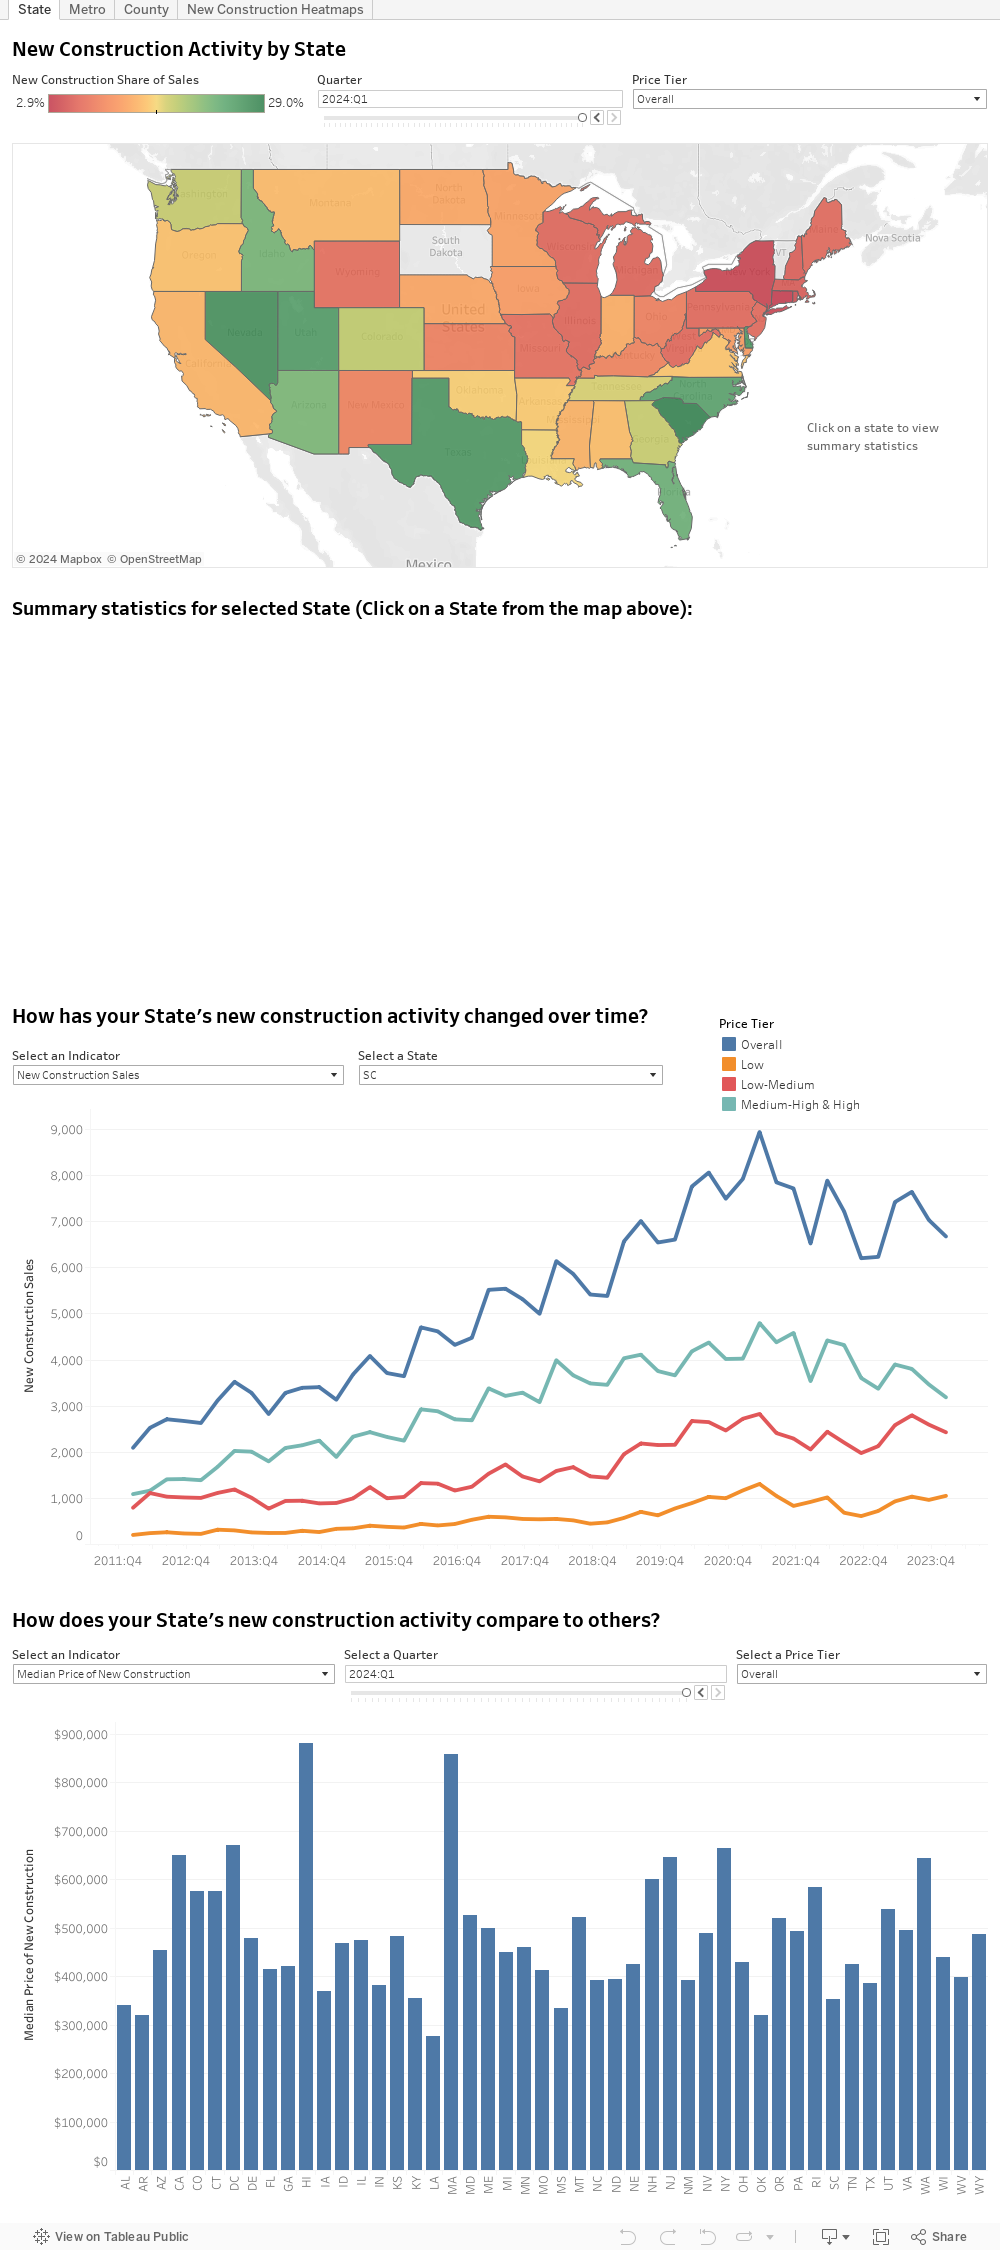
New Construction Trends for States, Metros, and Counties
Supply is currently severely constrained, especially for lower price tiers. New construction activity has been held back by burdensome regulations, not in my backyard (NIMBY) opposition, and cumbersome land use laws. These factors raise the cost of new construction, making it less economically viable to build at lower price points, where demand is greatest. The lack of new construction activity is contributing to rising home prices in areas that have seen an influx of people.
This has a myriad of effects on the long term health of the housing market, from the depression of homeownership rates among younger generations, to the exacerbation of mortgage risk, to shifts in geographic trends among high income workers.
Nevertheless, some states and metros, mostly in the South, have been successfully adding supply even at lower price points. The below interactive allows users to explore new construction data in their state, metro, and county.
Policy Solutions
There is a developing consensus that adding to supply is fundamental to addressing the challenges facing both would-be home buyers and renters in many areas of the country. A lack of adequate new supply has driven up prices and rents above sustainable levels. This is largely the result of overly restrictive zoning and other land use regulations which constrain the supply of new homes being built, especially in California and the West.
As the scatter plot below demonstrates, there is generally an inverse correlation between new construction’s share of home sales and Home Price Appreciation (HPA). The greater the percentage that newly constructed homes constitute of all home sales, the lower the rate of HPA. This effect is strongest for metros with higher employment growth over 1990-2018 (metros shown in black, along with the black dotted trend line). This is a key finding because it demonstrates that metros with robust employment growth AND high sales shares of newly constructed homes have less rapid home price appreciation. This bodes well for the future as Work from Home (WFH) allows the shift of jobs and housing demand to more affordable metros, especially ones with a greater ability to add more supply. This will help keep the rate of home price appreciation more in line with income growth.
Cumulative Home Price Appreciation, New Construction Sales and Employment Growth

The record low interest rates, new migration patterns, and the WFH shift have been by-products of the COVID19 pandemic. WFH has unleashed of formerly suppressed homeowner demand and created greater demand in lower cost areas. This will encourage more homebuilding, especially in areas with less “Not in My Back Yard-ism” (NIMBYism) — think the South and Southeast
The left line chart below shows new construction sales since 2012 for four metro areas that have had rapid home price appreciation and low levels of new construction as shown in the scatter plot above (Los Angeles, San Jose, San Francisco, and Seattle). They are among the metros with the largest net outflows of home sellers who then purchased another home over the period January 2018-August 2020. All four have stagnating levels of new construction sales.
Compare to the left line chart below which shows new construction sales over the same period for four metro areas that have had much less rapid home price appreciation and high levels of new construction as shown in the scatter plot above (Austin, Raleigh, Durham, and Charlotte). They are among the metros with the largest net inflow of home sellers who then purchased another home over the period January 2018-August 2020. All four have rapidly increasing levels of new construction sales.

A review of permit data for 1-4 unit permits confirms these findings and ensures that the above trends will continue in the near future as permits provide about a one-year look forward of future new construction sales.
One of the simplest and most effective ways to add supply where it is needed is the abolition of single-family zoning. The purpose of zoning and land-use restrictions are to promote the general welfare; however, given the supply shortage, these laws are doing the opposite. Over time, the balance of power regarding development and redevelopment of private property has shifted from property owners to NIMBYism. While NIMBYism is usually thought of as being aimed at restricting large-scale multifamily developments, in fact the biggest impact has been to constraint 2-, 3-, and 4-family structures (Light Touch Density or LTD).
In 1950, LTD structures comprised 19% of all housing, and these were largely interspersed with one-unit structures. By 2008 (latest data available), LTD structures were largely zoned out of one-unit areas and their share had dropped to 8%. We estimate that retuning to the same level of LTD as in 1950 has the potential to add as many as 12.5 million housing units over time, or an additional 10% to today’s existing housing stock.
The positive result of these solutions will be that housing becomes more affordable on average as demand shifts to less expensive areas and more supply helps to keep home price appreciation more in line with income growth.
To read more about LTD, please click here.
To listen to our briefing on new construction, please click here.
For more on Zillow Research, please click here.
For questions, please contact Ed Pinto or Tobias Peter.