State and County Housing Market Indicators: Update for 2022
Housing markets are inherently local as many reports show. While reliable data for larger metros and states are relatively easy to find, they often don’t exist for smaller counties. The AEI Housing Center’s State and County data fill this void by providing comprehensive insights into various housing indicators, including price, supply, new construction activity, and mortgage risk for most of the country.
Key takeaways from the State and County Housing Market Indicators for 2022
- Home prices remained highest on the coasts: out of the 10 most expensive counties, 6 were in California, 3 were in the Northeast, and 1 was in Wyoming.
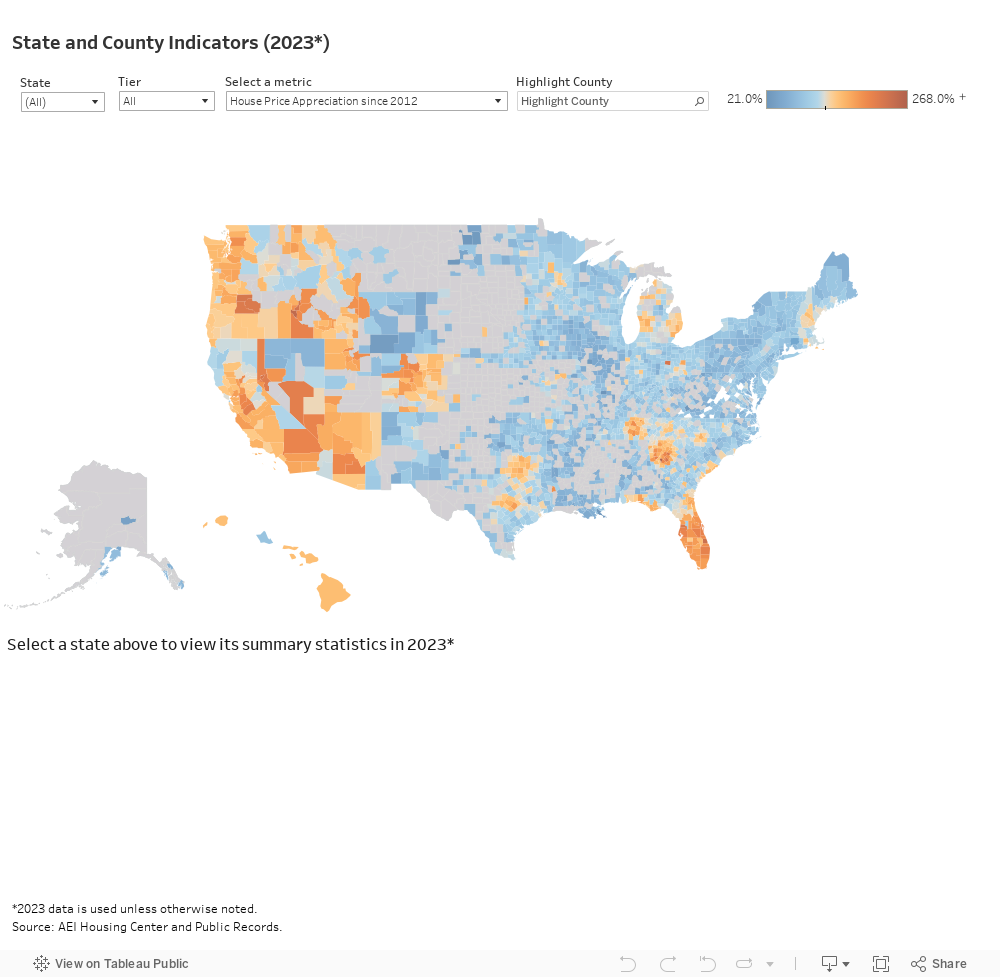
- Counties in the West and Florida experienced the most significant price increase since the start of the home price boom in 2012.
- Year-over-year home price appreciation (HPA) was positive in over 97% of the counties. It was particularly strong in Florida, where 58 out of 67 counties experienced HPA in excess of 10%.
- The supply of existing homes remained tight across the nation. Months’ supply was below 6 months, which is generally considered the demarcation point between a buyer’s and seller’s market, in over 98% of the counties.
- New construction activity varied across localities: the South generally had a higher share of new construction sales. The share of new construction sales was higher in the move-up than the entry-level segment.
- Mortgage risk varied with 52% of counties having a medium level and 44% of counties having a high level of stressed default risk. The move-up segment was generally less risky than the entry-level segment, which had more higher-risk FHA loans
To download the 2022 and historical data back to 2012, click here.
The nation in 2022 by the numbers
- Median sale price: $326,500
- Home Price Appreciation (HPA) since 2012: 116%
- Year-over-year rate of HPA: 12.5%
- Months’ supply: 2.5 months
- Share of new construction sales: 11.3%
- AEI stressed mortgage default rate: 11.4%
To explore the Housing Market Indicators in a county, hover on the map or select a state.
Data
The primary data used in this report are public records data from First American via Data Tree. We utilize information in the deed file, which provides information about the sale and mortgage, as well as the tax assessor file, which provides information on when a home was built and its geo-coordinates. These data are first anonymized and then combined with the following datasets:
- Home Mortgage Disclosure Act (HMDA)
- National Mortgage Default Rate
- CoreLogic’s LLMA
- BlackKnight’s McDash
- Fannie Mae Single-Family Loan Performance
- Freddie Mac Single Family Loan Level Data
- FHA Snapshot
The match rate varies by county and state, but averages around 60-65%. The matched sample, which is representative of the overall data, is then weighted up.
Months’ supply data are computed by dividing listings counts with existing home sales. These data are broken out into four price tiers and are provided by Zillow.
Price Tiers and Price Segments
Housing policies, new construction activity, and access to leverage can create very different home price appreciation trends depending on price tier. For this reason, this report distinguishes between different price tiers based on leverage.
The 4 price tiers are defined as follows:
- Low: all sales below the 40th percentile of FHA sales prices
- Low-medium: all sales at or below the 80th percentile of FHA sales prices
- Medium-high: all sales at or below 125% of the GSE loan limit
- High: all other sales
The entry-level segment consists of the low and low-medium price tiers and the move-up segment consists of the medium-high and high price tiers.
We estimate quarterly price tier cutoffs using the FHA Snapshot dataset and FHFA’s loan limits at the metro level. When there are fewer than 200 FHA loans in a year, we pool all FHA loans at the non-metro state level. For the demarcation between medium-high and high tier, we multiply a county’s loan limit by 1.25 to account for an 80% LTV, which is the median LTV of loans taken out at the loan limit.
AEI Mortgage Default Rate
The AEI Mortgage Default Rate, which measures how the loans originated in a given month would perform if subjected to the same stress as in the financial crisis that began in 2007. This is similar to stress tests routinely performed to ascertain an automobile’s crashworthiness or a building’s ability to withstand severe hurricane force winds. Loans with default rates of 7% or less are considered low risk, those with default rates of 7.01% to 14% are considered medium risk, and those with higher default rates are considered high risk. For more on the methodology, please see here.
Home Price Appreciation (HPA)
We measure the cumulative HPA since 2012. The HPA is a “quasi” repeat sales index with a hedonic element. The index measures HPA by constructing an artificial sales pair consisting of one actual sale and one “artificial” sale as measured by the property’s Automated Valuation Model (AVM.) The AVM approximates a property’s sale price at a given point in time. The AVM used is unbiased. For more on the methodology, please see here.
New construction sales
We identify new construction sales primarily from the public records and fill in data gaps using Zillow data and/or listings data. We rely mainly on the Year Built variable in the Assessor data. If the Year Built is missing, we check the seller name against a database of around 500 builders names and search for key words associated with builders. If this fails, we check whether Zillow has information about the property’s Year Built or its Use Code, which helps us determine the new construction status. If we cannot ascertain any information about the property, we mark it as an existing home. These data help us determine the new construction status. We only count the first sale of a home as a new construction.
We have undertaken a rigorous quality control process of random sampling and checking of new constructions and existing homes using Zillow data, Google street view and satellite images. We find around 2% false positives and 1% false negatives. There is an estimated 1-2 months lag with this methodology. We also fail to identify owner-built homes without a long lag.
The new construction flag allows us to monitor new construction sales at the property level, as well as accurately estimate new home sales at fine geographic levels.
Virginia enclaves
We account for low sales counts in Virginia independent cities and some smaller counties by combining these entities with their surrounding counties. The housing market indicators in these entities are the combined average of the smaller and the larger absorbing county. The table below shows all the changes:
| Independent city or small county: | Absorbing county: |
| Bristol, VA | Washington, VA |
| Buena Vista, VA | Rockbridge, VA |
| Charlottesville, VA | Albemarle, VA |
| Colonial Heights, VA | Chesterfield, VA |
| Covington, VA | Alleghany, VA |
| Emporia, VA | Greensville, VA |
| Fairfax City, VA | Fairfax, VA |
| Franklin, VA | Isle of Wight, VA |
| Fredericksburg, VA | Spotsylvania, VA |
| Galax, VA | Carroll, VA |
| Harrisonburg, VA | Rockingham, VA |
| Hopewell, VA | Prince George, VA |
| Lexington, VA | Rockbridge, VA |
| Manassas, VA | Prince William, VA |
| Manassas Park, VA | Prince William, VA |
| Martinsville, VA | Henry, VA |
| Norton, VA | Wise, VA |
| Radford, VA | Montgomery, VA |
| Roanoke City, VA | Roanoke, VA |
| Salem, VA | Roanoke, VA |
| Staunton, VA | Augusta, VA |
| Staunton, VA | Augusta, VA |
| Waynesboro, VA | Augusta, VA |
| Winchester, VA | Winchester, VA |
To contact the authors
Edward Pinto, Co-Director, AEI Housing Center ([email protected])
Tobias Peter, Co-Director, AEI Housing Center ([email protected])