Land Price and Land Share Indicators
Why are land price and land share indicators important?
- The price of land represents a net market value for a variety of factors such as size and shape of the lot, access to jobs, type of street, commute, schools, crime, weather, neighborhood, amenities, etc.
- For the first time, benchmark pricing of residential land is available at fine geographies for much of the United States.
- Previous work found that the increase in the land share of house value during the last boom was a significant predictor of the decline in house prices during the bust (the “canary in the coal mine”). This highlights the value of focusing on land in assessing house-price risk.
Methodology
AEI-adjusted land price and land share indicators are based on data for 2012 from “The Price of Residential Land for Counties, ZIP Codes, and Census Tracts in the United States” by Davis (Rutgers), Larson (FHFA), Oliner (AEI), and Shui (FHFA). However, due to potential biases (anchored to tax assessments and a limitation to GSE appraisals), the Davis et al. data likely understate the amount of home price appreciation and, by extension, the amount of increase in land prices. Therefore, we enhance the Davis et al. data using AEI’s constant-quality home price appreciation index. To read the detailed methodology, please click here.
Data Download
AEI-adjusted land prices and shares for 2012 forward are available for download in a spreadsheet. We provide data for the majority of the country at the census tract, ZIP code, county, metro, state, and national level by year. These data are free of charge. To download the data, please click here.
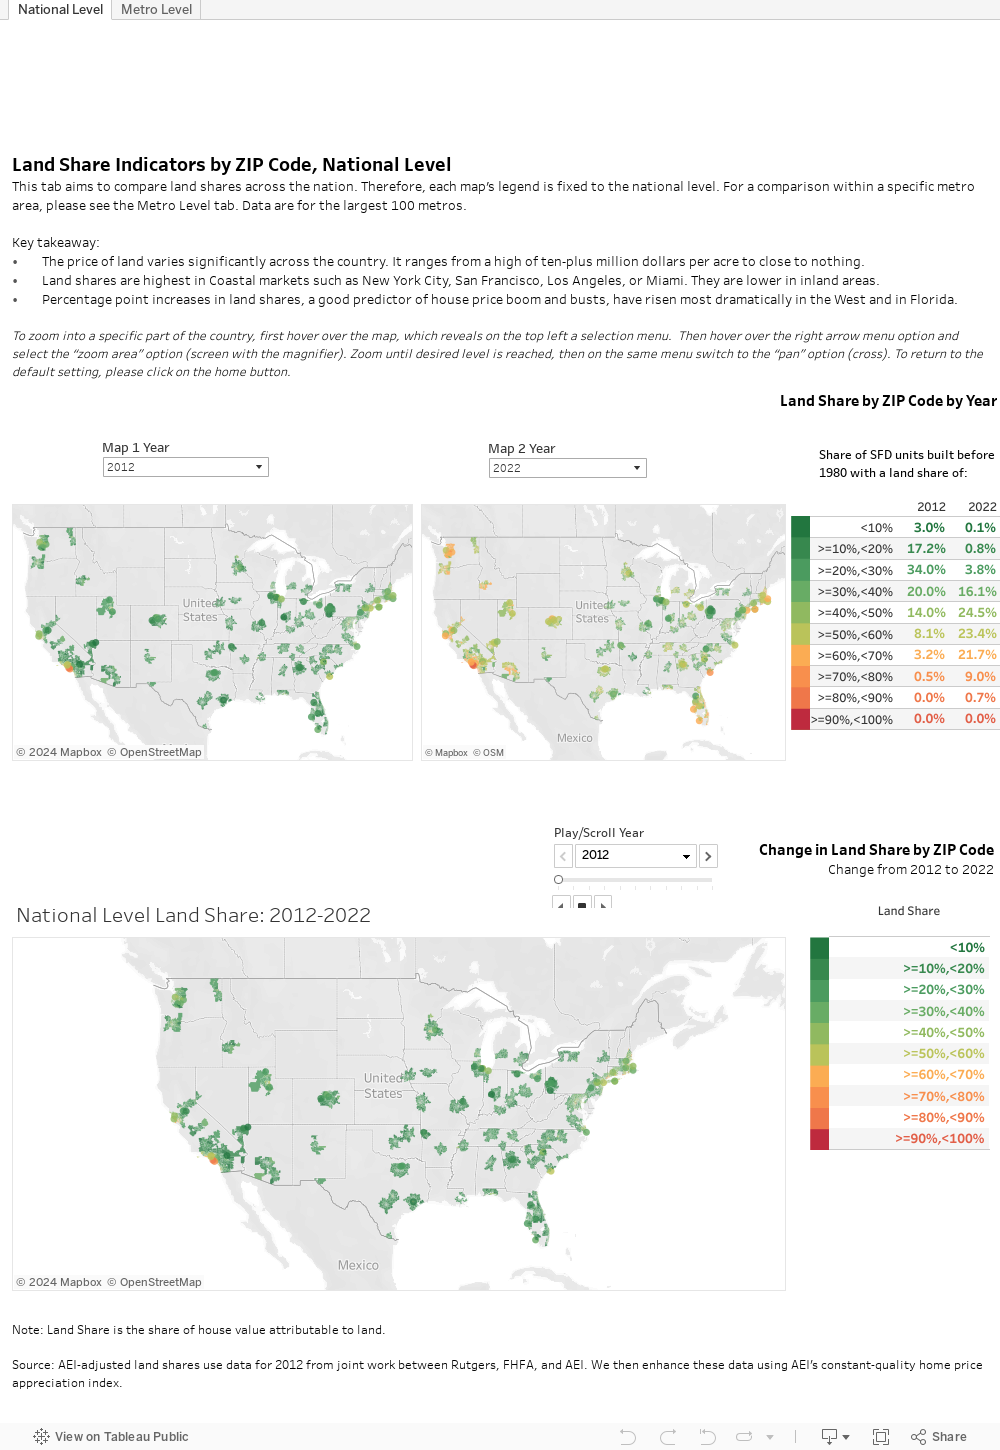
Data Interactive
The land interactive provides land price and land share indicators for the largest 100 metros in the country. The data are at the ZIP code level for each year. The interactive also shows a map with the percentage point change in land share between 2012 and 2022.
For historical data on the nominal value and price indices for housing, land, and structures by Morris A. Davis click here.