The Carpenter Index
They can build it, but can they afford it?
Ed Pinto and Tobias Peter
To download the Carpenter Index data, please click here.
Key Points
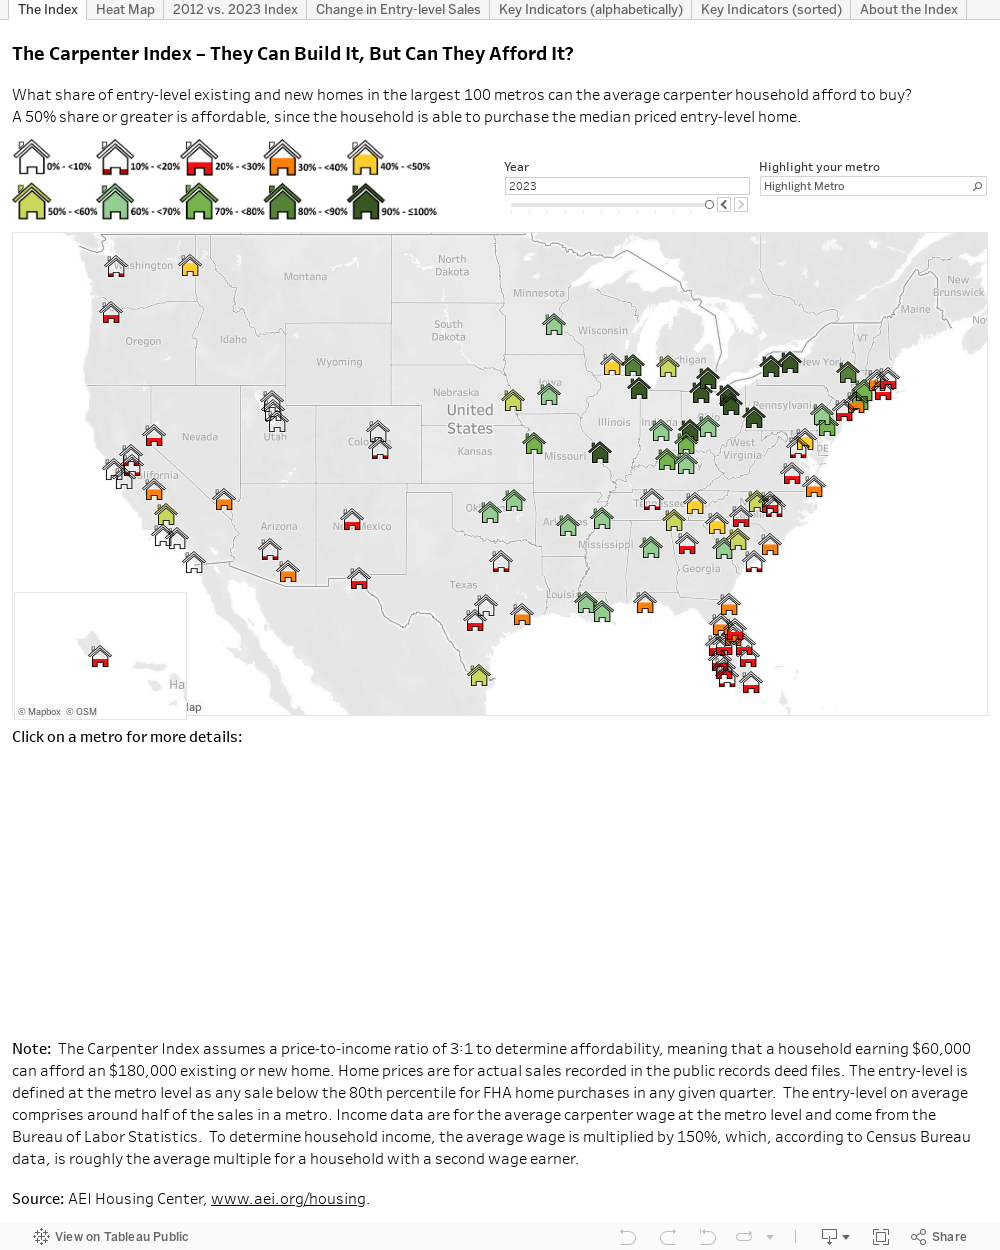
- The AEI Carpenter Index provides answers to some of the most challenging questions facing first-time homebuyers by comparing housing affordability across the nation. The index uses the average carpenter household as a proxy for a blue-collar worker.
- In 59 of the 100 largest metros, most entry-level or starter homes were not affordable for the average carpenter household in 2022. In 2012, this was the case for just 7 of those 100 metros.
- Madison, Lexington, Baton Rouge, Los Angeles, and San Diego ranked as the least affordable metros, while Buffalo, Cleveland, Pittsburgh, Rochester, and Toledo were all tied at #1 to rank as the most affordable metros. These 5 metros have each had a #1 ranking for all 11 years of the Carpenter Index. Miami, Houston, Virginia Beach, and Las Vegas ranked in the middle.
- Philadelphia (moved up to #16 in 2022 from #55 in 2012), Albany (moved up to #11 in 2022 from #34 in 2012), and Akron and St. Louis (ranked #1 in 10 of 11 years – only missing in 2022) all deserve honorable mention.
- Generally, affordability is highest in the Midwest, followed by the Northeast and Southeast. The least affordable metros are all in the West.
- Madison is the least affordable metro in the Midwest (Carpenter Index: 51% of entry level homes are less than 3x income)
- Boston is the least affordable metro in the Northeast (Carpenter Index: 19%)
- Raleigh is the least affordable metro in the Southeast (Carpenter Index: 15%)
- Austin is the least affordable metro in the Southwest (Carpenter Index: 15%)
- Provo is the least affordable metro in the Mountain West (Carpenter Index: 9%)
- Los Angeles is the least affordable metro in the West (Carpenter Index: 4%)
- The driver of worsening FTB affordability from 2012 to 2022 was that home prices increased faster than incomes in the majority of metros.
The AEI Housing Center’s 2022 Carpenter Index is one of the best resources for understanding entry-level home affordability. Just how unaffordable has entry-level housing become? The AEI Carpenter Index quantifies this issue by asking the question, “Can the people who build homes afford to buy them?” While the results vary among the top 100 largest metros, over the last 11 years there has been a clear downward trend towards less affordability as home prices have risen faster than wages due to policy mistakes at the federal and local levels.
The Carpenter Index starts with average carpenter wages at the metro level, which is around $51,000. It then assumes a household income that totals 150% of the carpenter’s wage, which is roughly the national average. This yields a typical total carpenter household income of $77,000. A common rule of thumb is that, to be considered affordable, a household should purchase a house no more than three times household income. The typical carpenter household could then afford a home of up to $231,000. To complete the index, we observe the share of entry-level homes that a carpenter household could purchase at three times its income. The Carpenter Index thus combines both local wages and home prices into an affordability measure for the blue-collar employees we depend on to build new homes. The index renders metros directly comparable to each other in terms of their affordability. A Carpenter Index of 50% or greater is considered affordable since the average household is able to purchase the median entry-level home. The lower the index is, the more unaffordable a metro becomes.
To put the Carpenter Index into concrete terms, one can go on any real estate website and search for homes listed at three times the carpenter household’s income, which of course varies by metro. The results are telling. The following photos are representative of ones sold in 2021 near the maximum price point the average carpenter household can afford in the respective metro. For example, 4% of carpenter households in Los Angeles can afford a home like the photo on the left, while 100% of carpenter households in Pittsburgh can afford a home like the photo on the right, and 46% of carpenter households in Houston can afford a home like the photo in the middle.
Los Angeles, CA
 Home cost: $286,000 (4% of entry level)
Home size: 2 bed, 1 bath, 842 sq. ft.
Home cost: $286,000 (4% of entry level)
Home size: 2 bed, 1 bath, 842 sq. ft.
Houston, TX
 Home cost: $216,000 (46% of entry level)
Home size: 3 beds, 1.5 baths, 2,150sq.ft.
Photo credits: Zillow
Home cost: $216,000 (46% of entry level)
Home size: 3 beds, 1.5 baths, 2,150sq.ft.
Photo credits: Zillow
Pittsburgh, PA
 Home cost: $251,000 (100% of entry level)
Home size: 3 beds, 2 baths, 1,890sq.ft.
Home cost: $251,000 (100% of entry level)
Home size: 3 beds, 2 baths, 1,890sq.ft.
The Carpenter Index – An Overview (2019)
To download the background static report from 2019, please click here.
About the Index
Detailed methodology The Carpenter Index assumes a price-to-income ratio of 3:1 to determine affordability, meaning that a household earning $60,000 can afford an $180,000 existing or new home. Home prices are for actual sales recorded in the public records deed files. The entry-level is defined at the metro level as any sale below the 80th percentile for FHA home purchases in any given quarter. The entry-level on average comprises around half of the sales in a metro and consists of around 75% first-time homebuyers. Income data are for the average carpenter wage at the metro level and come from the Bureau of Labor Statistics. To determine household income, the average wage is multiplied by 150%, which, according to Census Bureau data, is roughly the average multiple for a household with a second wage earner. We track the Carpenter Index for the largest 100 CBSAs, to which we refer as metros. We select them by their public record’s sales total from 2012 to 2019. CBSAs are defined by the OMB as “metropolitan statistical areas have at least one urbanized area of 50,000 or more population, plus adjacent territory that has a high degree of social and economic integration with the core as measured by commuting ties.”
To Contact the Authors
Edward Pinto, Director, AEI Housing Center ([email protected])
Tobias Peter, Director of Research, AEI Housing Center ([email protected])
About the AEI Housing Center AEI’s Housing Center (www.AEI.org/housing) undertakes evidence-based research that expands the body of knowledge concerning housing markets and finance. It provides objective and transparent housing market indicators at the national, metro, and fine geographic levels.