The Tech Worker Index
Best and Worst Metro Areas for Tech Workers to be Homebuyers
July 27, 2022 | Ed Pinto and Tobias Peter
To download the full report, please click here.
To download the data, please click here.
What is the Tech Worker Index?
- Tech workers are a proxy for professional or white-collar workers, making it a useful way to illustrate why the Work from Home (WFH) explosion has fueled the Great American Land Rush.
- WFH is having a long term influence on migration patterns and housing demand; it is changing where people live, what type of homes they want, how they spend their time, where homes get built, creating new traffic patterns, affecting infrastructure needs, and impacting other aspects of life too numerous to mention.
- More broadly, WFH may help ease persistent housing unaffordability challenges by allowing households to more freely move to where supply is more plentiful and home prices more affordable.
- The Great American Land Rush is driven by the large differences in land cost primarily between coastal metros in the West and Northeast and metros in the South and Southwest and by the land cost differences among urban, suburban, and rural areas of individual metros.
The Tech Worker Index – An Overview
Report Interactive
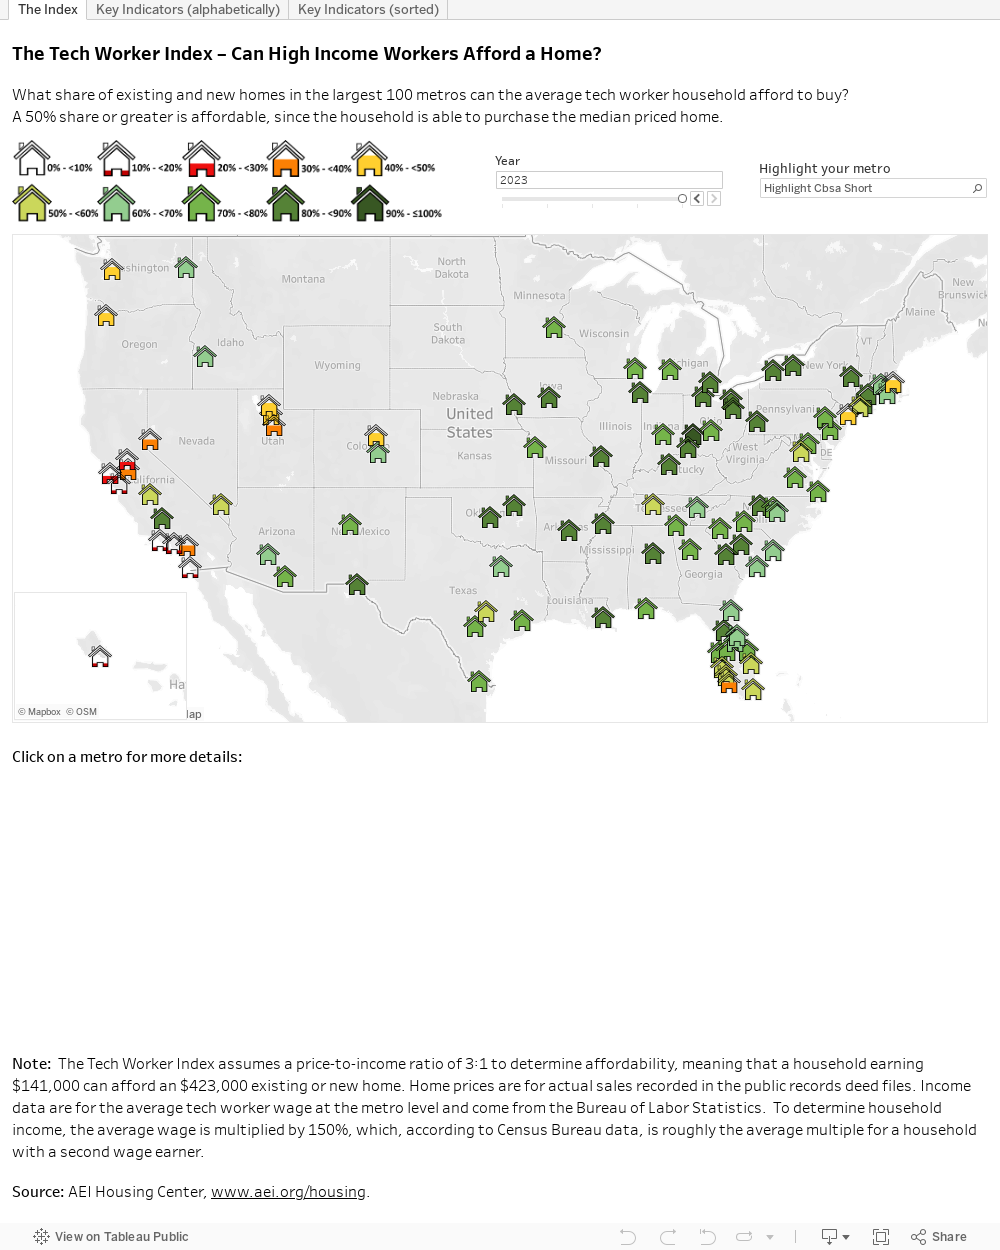
This interactive allows users to explore The Tech Worker Index, as well as further analysis around the index for the nation’s largest 100 metros across various sheets.
About the Index
Methodology
The Tech Worker Index assumes a price-to-income ratio of 3:1 to determine affordability, meaning that a household earning $141,000 can afford a $423,000 existing or new home.
Income data are for the average “Computer and Mathematical Occupations” wage at the metro level and come from the Bureau of Labor Statistics. To determine household income, the average wage is multiplied by 150%, which, according to Census Bureau data, is roughly the average multiple for a household with a second wage earner.
Home prices are for actual sales recorded in the public records deed files. Housing characteristics such as square footage, number of bedrooms, and number of bathrooms are recorded in the public records assessor files.
We track the Tech Worker Index for the largest 100 CBSAs, to which we refer as metros. We select them by their public record’s sales total from 2012 to 2021. CBSAs are defined by the OMB as “metropolitan statistical areas have at least one urbanized area of 50,000 or more population, plus adjacent territory that has a high degree of social and economic integration with the core as measured by commuting ties.”
To Contact the Authors
Edward Pinto, Director, AEI Housing Center ([email protected])
Tobias Peter, Director of Research, AEI Housing Center ([email protected])
About the AEI Housing Center
AEI’s Housing Center (www.AEI.org/housing) undertakes evidence-based research that expands the body of knowledge concerning housing markets and finance. It provides objective and transparent housing market indicators at the national, metro, and fine geographic levels.
Featured Reading
