Best and Worst Metro Areas to Be a First-time Homebuyer
To view or download the static report, please click here.
To download the data, please click here.
The AEI Housing Center’s 2022 First-time Homebuyer Report is the best resource for understanding first-time homebuyer (FTB) affordability. This report analyzes over 5 million FTB sales from 2013 to 2022 for the largest 60 metros. We rank these metros based on their affordability for FTBs by using the ratio of home prices to income for each individual FTB. In 2022, Pittsburgh was the most affordable metro, while Salt Lake City ranked as the least affordable one.
The focus is on first-time homebuyers since this is the group most harmed by home prices driven higher by government-induced supply constraints and demand boosters such as looser underwriting standards or ultra-low interest rates. This extra demand is quickly capitalized into higher home prices that push entry-level homes even further out of reach. Additionally, unlike repeat buyers who in part benefit from higher home prices when selling one asset to buy another, FTBs are often forced to take on greater amounts of debt to attain homeownership.
Here are several key findings from the study:
- The prospect of becoming a FTB varied widely by metro in 2022. Out of the largest 60 metros, Pittsburgh was the most affordable metro with a FTB affordability ratio of 2.8, while Salt Lake City was the least affordable metro with a ratio of 5.3. Pittsburgh has occupied the top rank since 2013, while Salt Lake City moved into the bottom rank in 2021.
- Across the 60 metros, the median FTB affordability ratio was 3.8, meaning the median FTB spent 3.8 times household income to purchase a home in 2022. This is up from 3.0 in 2013. FTB affordability was further worsened by rising mortgage interest rates, which averaged 5.3% in 2022 compared to 4.0% in 2013.
- The driver of worsening FTB affordability from 2013 to 2022 was simple. Home prices increased faster than incomes in the majority of metros. At the most extreme, Boise’s prices for FTBs increased 188% (from $164,000 to $472,000) but incomes increased only 90% (from $52,000 to $99,000), causing the affordability ratio to jump 1.5 points from 2013 to 2022.
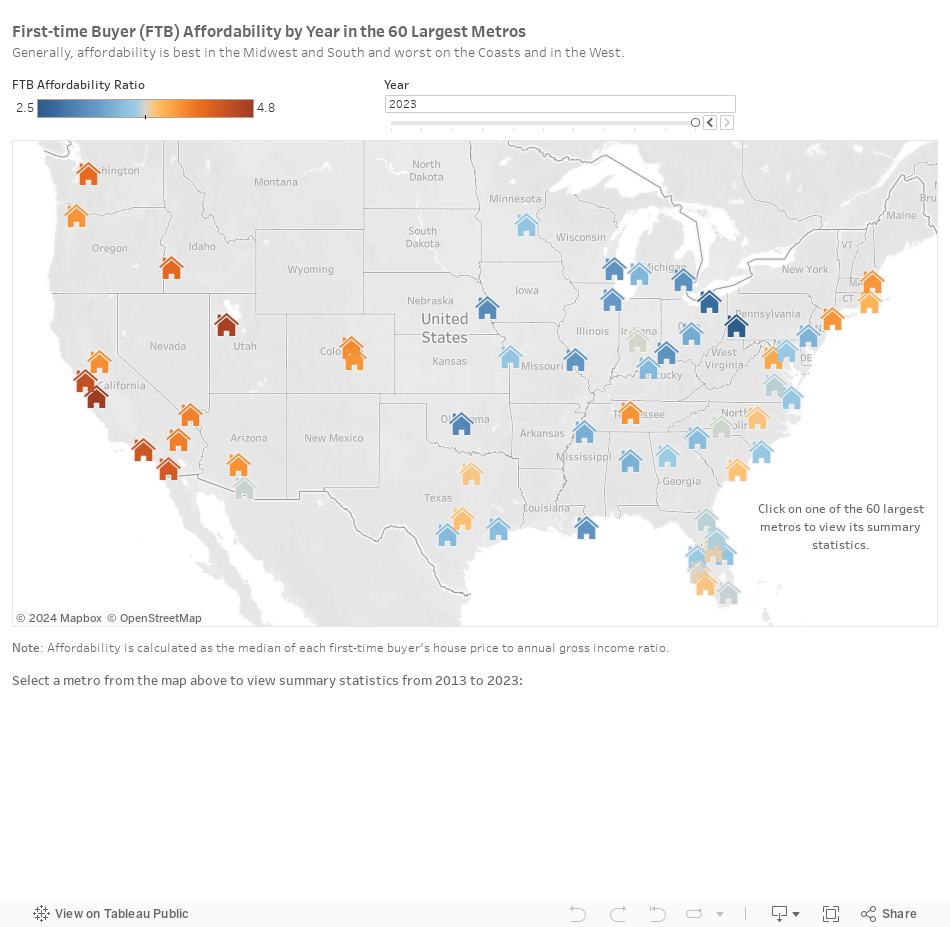
Best & Worst Metros for FTB Affordability
The prospect of becoming a first time homebuyer (FTB) varied widely by metropolitan area in 2022.
Pittsburgh ranked as the best – or most affordable—metro for FTBs, while Salt Lake City ranked as the worst – or least affordable. Of the ten most affordable metros in 2022, eight were in the Midwest, one was in the South, and one was in the Northeast. Of the ten least affordable, all were in the West.

As the map shows, generally, affordability is highest in the Midwest and South and lowest on the Coasts and in the West.
To measure FTB affordability in a year, we first compute the price-to-income ratio for FTB transactions from 2013 to 2022, representing a total of over 5 million transactions. We then compute the median for each year and metro. The resulting affordability ratio thus accounts for the relative ease or difficultly for a FTB to afford a home given their income. The lower the ratio, the more affordable a metro is for FTBs; the higher the ratio, the more unaffordable a metro is for them.
(To learn more about a metro, simply hover over it or click on it to reveal detailed statistics below the map.)
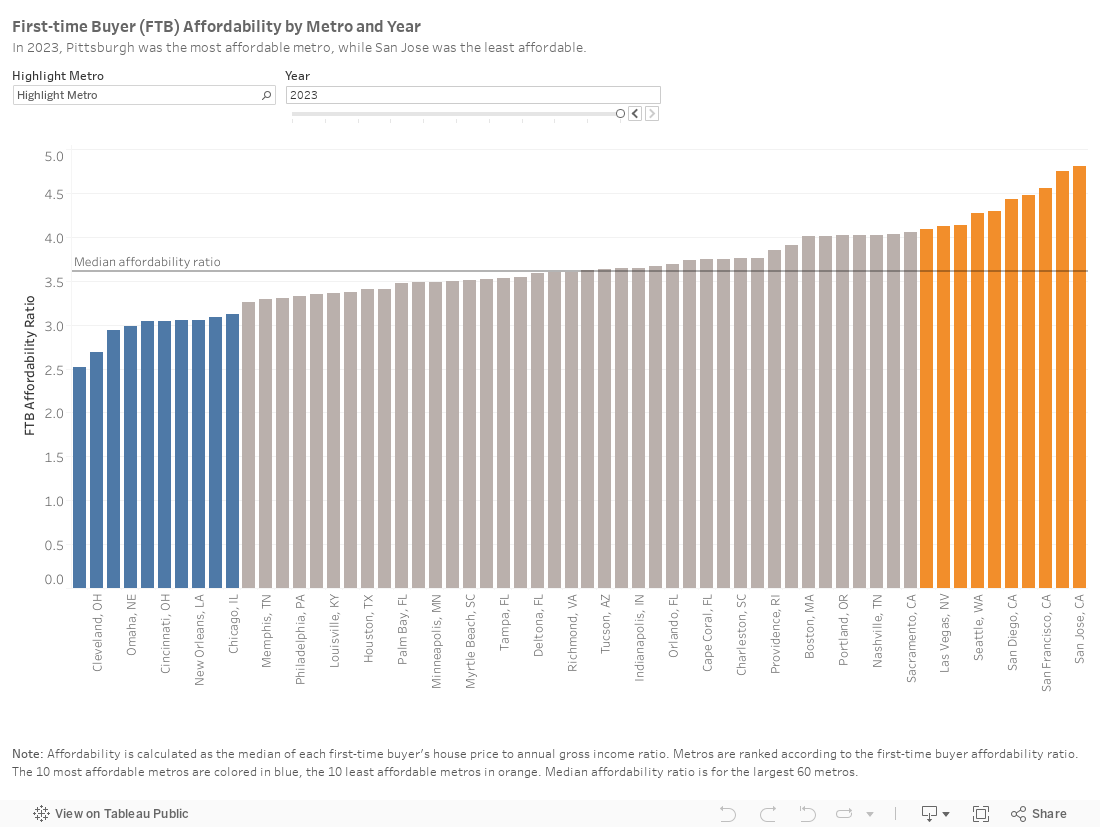
Out of the largest 60 metros, Pittsburgh was the most affordable metro with a FTB affordability ratio of 2.8, while Salt Lake City, with a ratio of 5.3 was the least affordable metro in 2022. Pittsburgh has occupied the top rank since 2013, while Salt Lake City moved into the bottom rank in 2021. Across the 60 metros, the median FTB affordability ratio was 3.8, meaning the median FTB spent 3.8 times household income to purchase a home. This is up from 3.0 in 2013. FTB affordability was further worsened by rising mortgage interest rates, which averaged 5.3% in 2022 compared to 4.0% in 2013. In 2022, the median FTB had almost doubled his or her monthly mortgage payment compared to 2013 (see table).

In 2022, Las Vegas, NV and Denver, CO replaced Riverside, CA and Portland, OR among the 10 least affordable metros, while the 10 most affordable metros are unchanged from 2021.
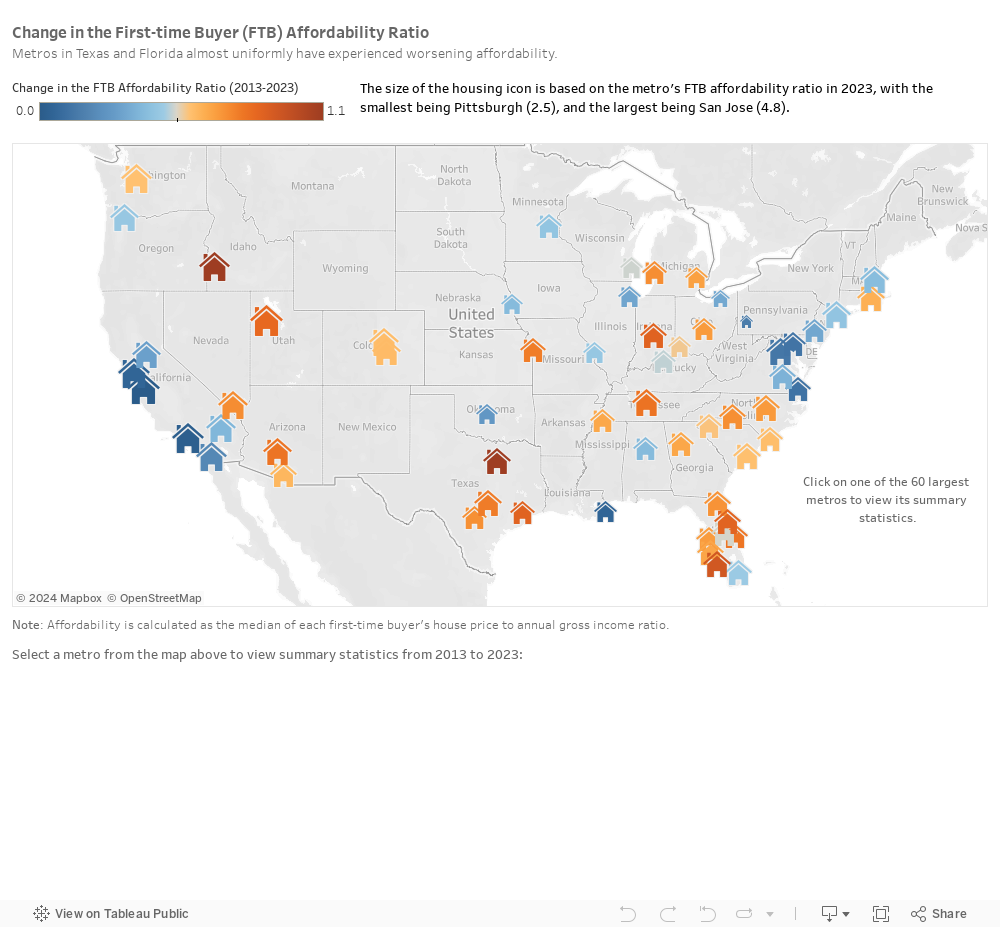
Changing FTB Affordability
As the map below shows, the largest 60 metros have seen major divergences in the change of first-time buyer (FTB) affordability. An orange coloring implies worsening FTB affordability (as measured by the median FTB price-to-income ratio for the metro), while a blue coloring implies a slightly worsening in the FTB affordability ratio from 2013 to 2022. The size of the housing icon is based on the metro’s FTB affordability ratio in 2022. The larger the size is, the less affordable the metro is in 2022.
A few trends stand out from the map. First, California and Northeastern (with the exception of Providence, RI) metros experienced only modest worsening in affordability, however given their high home prices many of these metros still rank as the most unaffordable in the nation. Second, other Western metros and those in Texas and Florida (with the exception of Miami), which have generally been more affordable in 2013, experienced more dramatic worsening affordability. Third, the remaining metros in the South and the Midwest were more idiosyncratic as some metros experience only modest changes (Omaha, NE), while others saw more substantial increases (Kansas City, MO). These trends are consistent with broader population movements, where people have been enabled by the pandemic and work from home opportunities to move to places with attractive climates, low taxes, strong economic growth, and lower home prices.
(To learn more about a metro, simply hover over it or click on it to reveal detailed statistics below the map.)
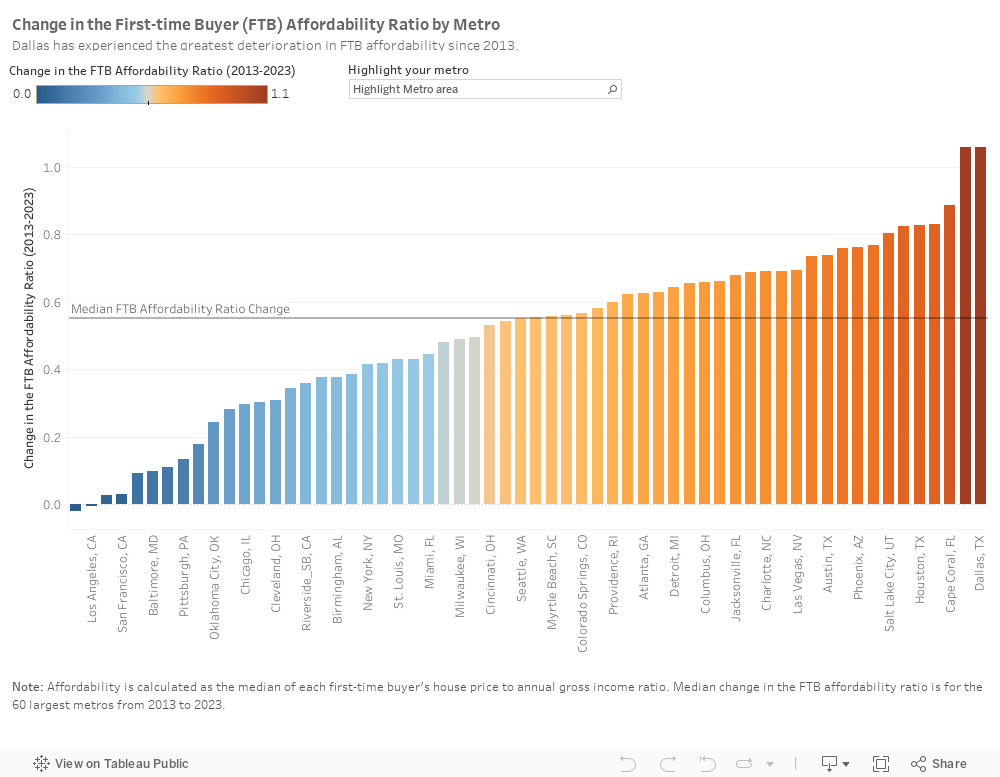
The next chart ranks metros according to their change in the FTB affordability ratio from 2013 to 2022.
FTB affordability has decreased only modestly in San Francisco, Baltimore, San Jose, Washington, DC, and Virginia Beach (shown in blue and to the left), but it has worsened the most in Boise City, Salt Lake City, Dallas, Colorado Springs, and Phoenix (shown in orange and to the right).
Across the 60 largest metros, the FTB affordability ratio increased by a median of 0.8 points from 2013 to 2022.
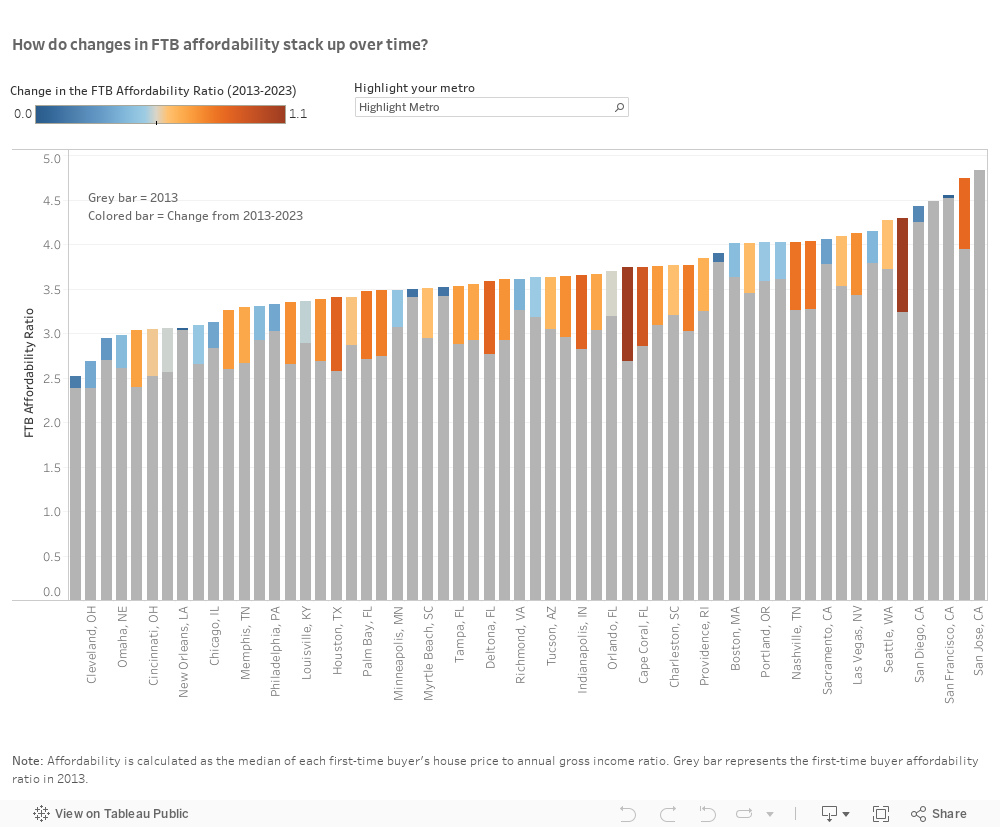
The next chart shows how changes in FTB affordability stack up over time. The grey bar shows the FTB affordability ratio in 2013, while the section in color at the top of each bar shows the change in the FTB affordability ratio from 2013 to 2022.
Among the ten most affordable metros, affordability has only worsened moderately since 2013, with the exception of Detroit and Columbus, which have become noticeably more unaffordable. As already noted, the metros with the highest home prices, particularly those in California and the Northeast, have seen relatively small increases in their affordability ratios. For example, Washington, DC and New York City have been surpassed by other metros. While Washington, DC ranked as the 55th most affordable metro (out of 60) in 2013, it ranks as the 41st most affordable in 2022. Similarly, New York City ranked 50th in 2013 but ranks 44th in 2022.
There were, however, some initially more affordable metros that are quickly becoming less affordable. Dallas, which back in 2013 was the 12th most affordable metro for FTBs, is now the 38th most affordable metro. Also, Cape Coral, FL, which was the 21st most affordable, is now only the 37th most affordable metro for FTBs.
Key Drivers of FTB Affordability
The driver of worsening first-time buyer (FTB) affordability from 2013 to 2022 was that home prices increased faster than incomes in each of the 60 metros covered by this report. Prices have been driven higher by government-induced supply constraints (such as local zoning laws) and demand boosters (such as looser underwriting standards or ultra-low interest rates), which are quickly capitalized into higher home prices that push entry-level homes even further out of reach.
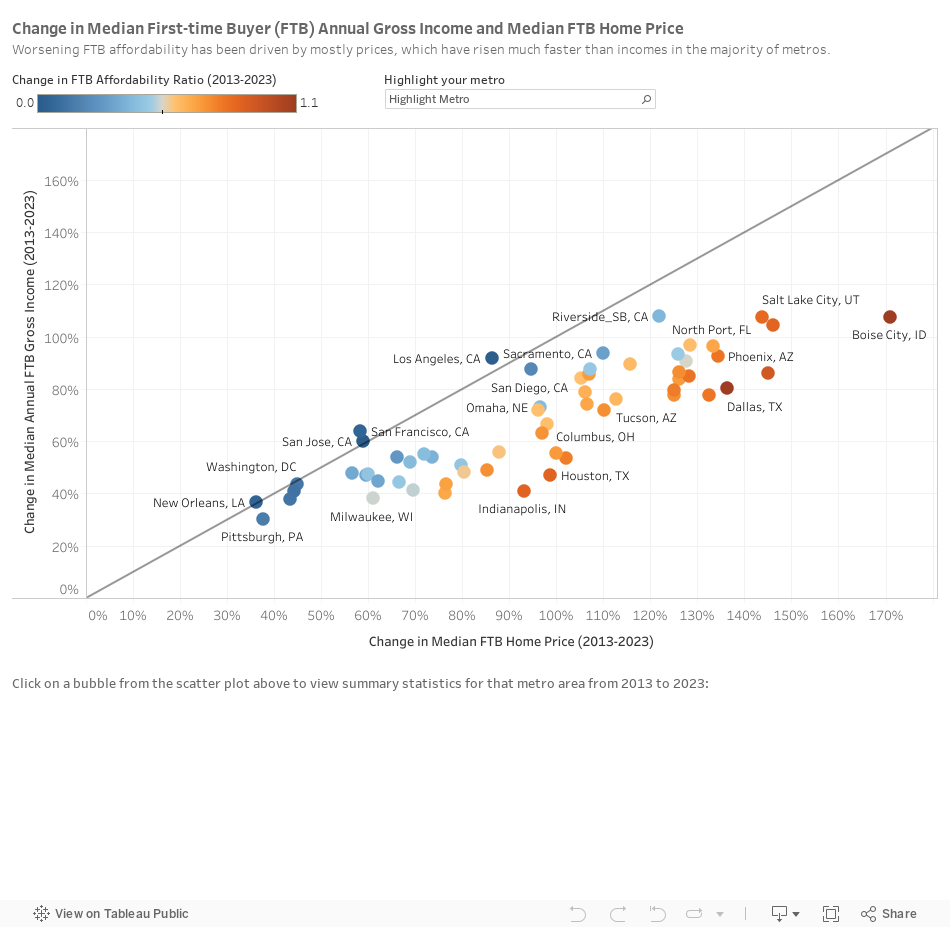
The scatterplot below compares changes in median FTB home prices to changes in median FTB incomes for the largest 60 metros. Each dot represents one metro. The 45-degree line indicates the same rate of change between prices and income. A dot below the line indicates faster home price change than income change. The coloring of the dot from blue to orange indicates the worsening in the FTB affordability ratio.
At the most extreme, Boise City’s prices for FTBs increased 188% (from $164,000 to $472,000) but incomes increased only 90% (from $52,000 to $99,000), causing the affordability ratio to jump 1.5 points.
At the other end, home prices and wage growth moved in near lockstep in metros such as San Francisco, San Jose, and Washington. (To learn more about a metro, simply hover over it or click on the dot to reveal detailed statistics below the map.)
Key FTB Metrics
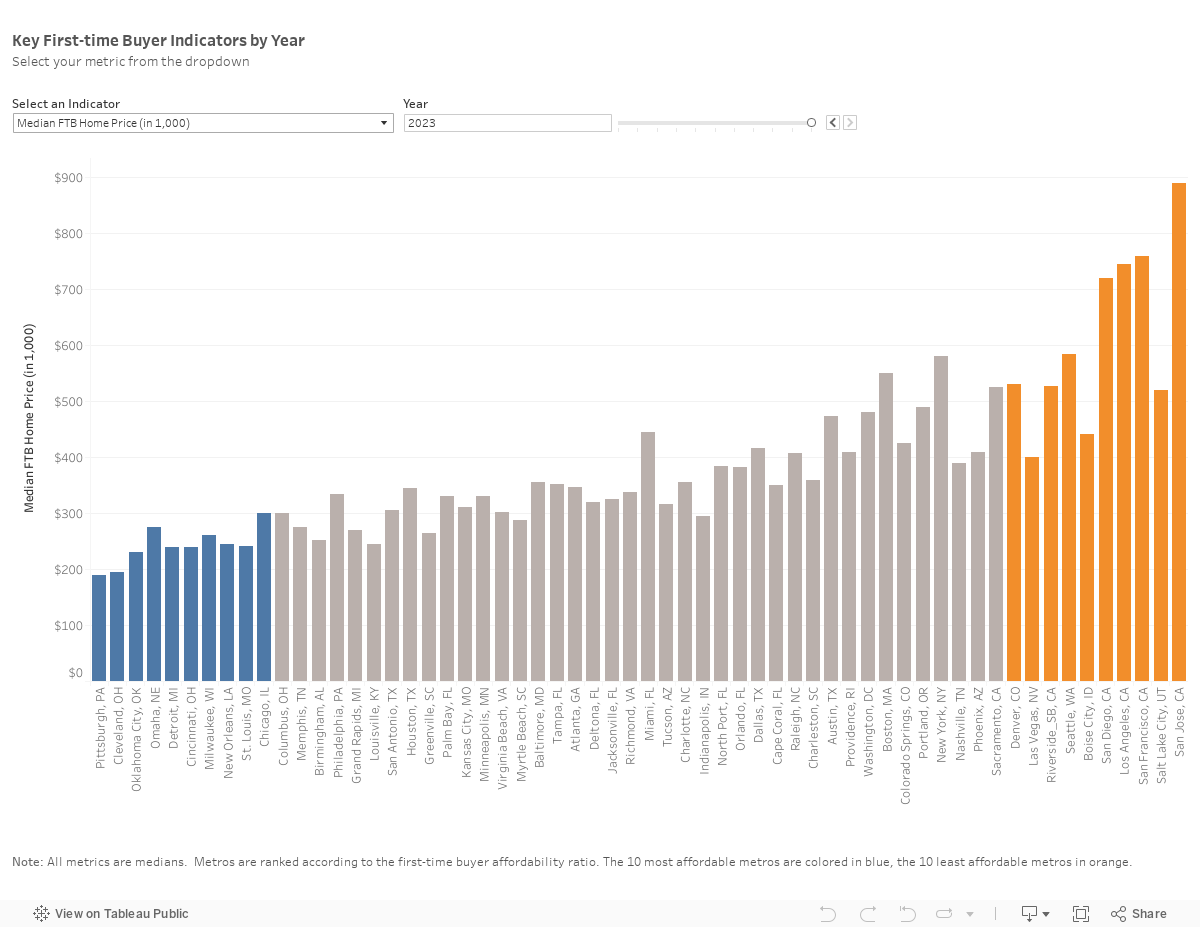
This chart below has a dropdown menu for different indicators: home price, gross annual income, price per sq. ft. of living area, and living area of the home.
The metros are sorted from best to worst first-time buyer (FTB) affordability, with the ten best metros colored in blue and the ten worst in orange.
Median home prices for FTBs correlate with affordability. Most of the ten most unaffordable metros had the highest home prices, while the ten most affordable metros generally had the lowest ones.
A similar pattern applied to FTB gross annual income. Therefore, when it comes to affordability, it’s not how much you make, but where you buy. San Jose’s prices were 4.2 times as high as Pittsburgh’s prices, while San Jose’s incomes were only 2.4 times as high as Pittsburgh’s incomes.
Price per sq. ft. of living area ranged from a low of $101 in Cleveland to a high of $687 in San Jose. However, 37 metros fell within a relatively narrow $100 range from $120 to $220.
The living area of the home reflects only small differences between the most and least affordable metros for FTBs. Metros with an older housing stock and lower new construction activity, such as Milwaukee or Minneapolis, had smaller FTB living areas than metros with a newer housing stock and higher new construction activity, such as Houston or Dallas.
Methodology
The FTB affordability study relies on over 5 million Agency FTB transactions between 2013 and 2022. The study does not consider FTB cash purchases, other-financed sales, and sales using private financing. The dataset combines anonymized public records data provided from First American via Data Tree, HMDA data, National Mortgage Default Rate (NMDR) data, Fannie Mae’s Single Family Loan Performance Data, and Freddie Mac’s Single Family Loan-Level Dataset. The data are weighted monthly at the county level.
We track FTB affordability for the largest 60 CBSAs, to which we refer as metros. We select them by their public records sales total from 2012 to 2019. CBSAs are defined by the OMB as “metropolitan statistical areas have at least one urbanized area of 50,000 or more population, plus adjacent territory that has a high degree of social and economic integration with the core as measured by commuting ties.”
To Contact the Authors
Edward Pinto, Director, AEI
Housing Center ([email protected])
Tobias Peter, Director of Research, AEI Housing
Center ([email protected])
About the AEI Housing Center
The AEI Housing Center (www.AEI.org/housing) has three primary objectives:
- Provide transparent and objective mortgage and housing market trends at unprecedented levels of detail;
- Foster a stable system of mortgage finance that promotes sustainable homeownership; and
- Develop market-based solutions to the nation’s shortage of economical housing.
We pursue these objectives through the use of the best available data and by producing rigorous research on important policy issues.